Sometimes it's good to take a step back and practice the fundamentals. For this week I decided to go back to an earlier Alteryx Challenge that is labeled as 'Foundation'.
Challenge 169 focuses on understanding how to import a text file and counting entries to find the highest value.
The data is from the 2019 Woman's World Cup that was held in France. The idea is to find the team that had the most wins during the cup after you figure out how to import the text file.
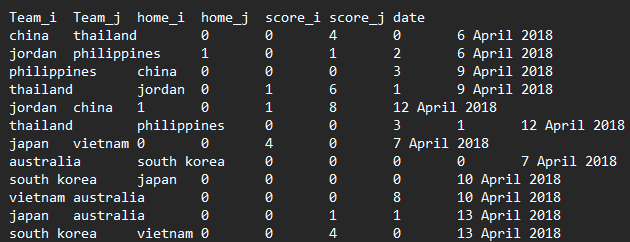
First, open up the text file with the data so you understand what the data rows look like, because in order to import a text file into Alteryx, you need to know if it's delimited and what it's delimited by. Each row in the data is the results from one game showing who the winning and losing teams were, whether it was a home game or not, the score for each team in that game, and the date. Notice that the data is delimited by tabs and the columns have headers in the first row.
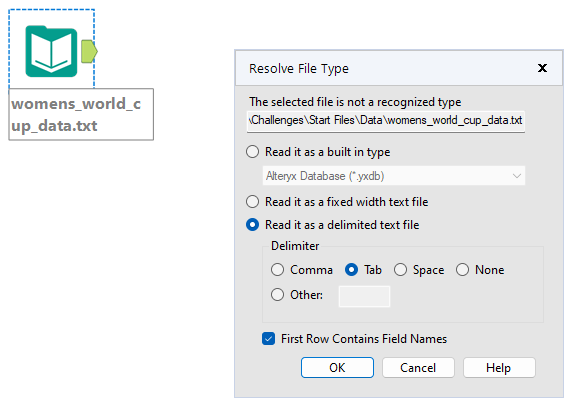
Next we drag the text file onto the canvas. Alteryx automatically adds an input tool to your canvas to read the file. A window will pop-up to configure how the data should be imported. Select the options below, add a browse tool to your input tool, and run the flow.
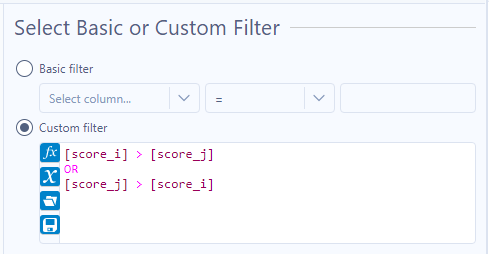
First, we want to filter out all the games that ended in a tie since that does not count as a win. Drag a filter tool onto the canvas, connect it to your input tool and configure the options as follow:
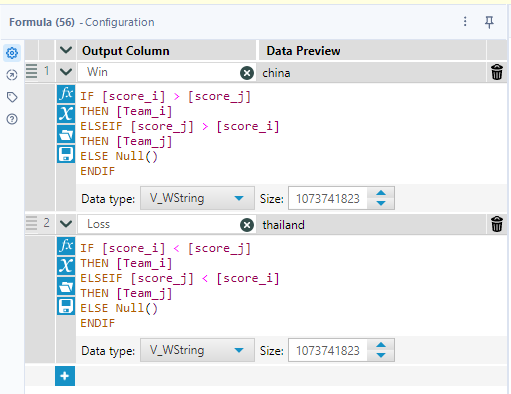
Next, we want to create a formula that puts the winning team names in a column. If you're interested in knowing which team had the most losses during the World Cup, you can create a similar formula for a column with the team names that lost games. Drag the formula tool to your canvas, connect it to the filter tool, and create the following statements:
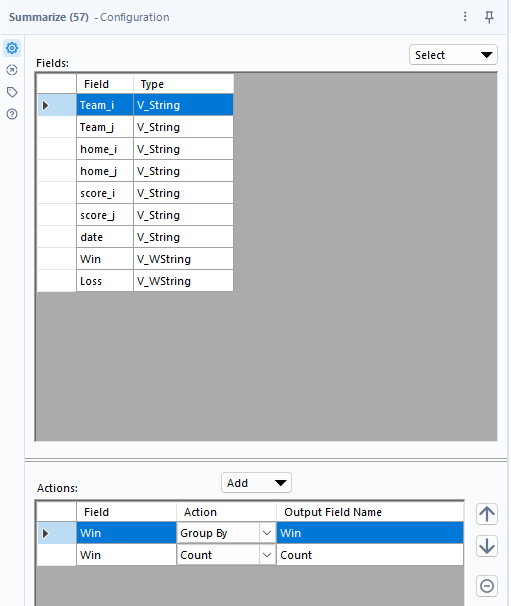
Now we can summarize to count all the occurrences of a team's name in the winning column. Drag the Summarize tool to you canvas, connect it to your formula tool, select to group by the team names in the 'Win' column, and count the number of times that team name occurs.
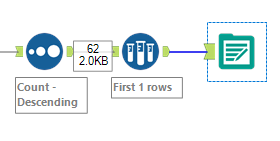
To get the results in the right order so the highest count is at the top, we can drag a Sort tool into the canvas, connect it to the summarize tool, and choose count being sorted as descending. Then add a Sample tool to the canvas to select only the first row - since we're only interested in the highest scoring team and in our data that is only one team. Lastly, add an output tool if you want to store the data somewhere.
Once the flow successfully runs, we can see that England won the most games with a count of 16.