For day 4 of Dashboard Week we used a dataset sourced from a census of squirrel sightings at select parks in New York City. The group that made the census also created a whole lot more fun squirrel themed content for their website (including a squirrel hotline!) which is definitely worth checking out: https://www.thesquirrelcensus.com/
The first step was cleaning and preparing the data. Some of this I did in Alteryx and some in Tableau Prep, depending on which tool was best for the job.
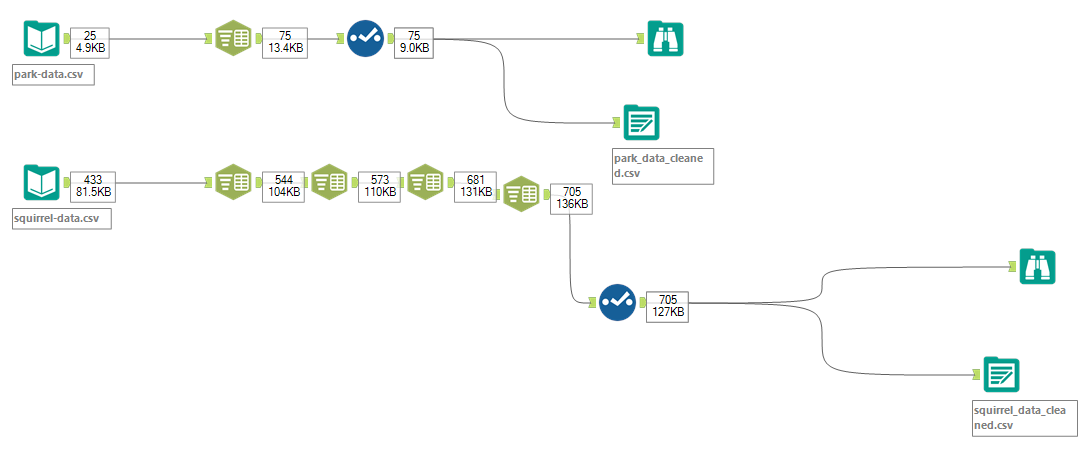
I used Alteryx to split the data up into more rows. For example, a squirrel might be recorded as "running, climbing, jumping". With Alteryx I was able to split on the ',' character to give each activity its own row, making the data easier to work with in Tableau. Here's what the Alteryx flow looked like:
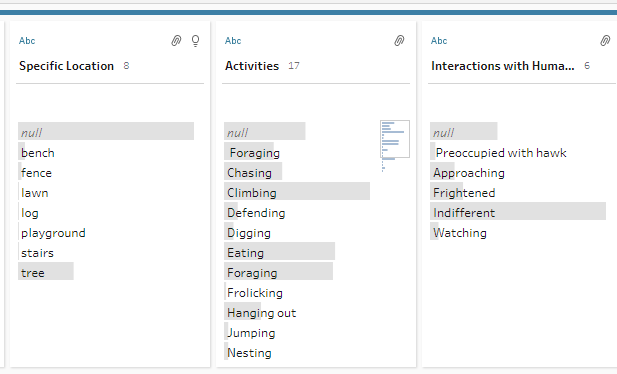
I used Tableau prep to better standardize the data. For example, one squirrel may have been recorded as "in a tree", another as "in tree", and another as "on a tree". With prep I could rename these so they all read as just "tree" and Tableau could recognize them as the same location. Here's what that looked like in Tableau Prep:
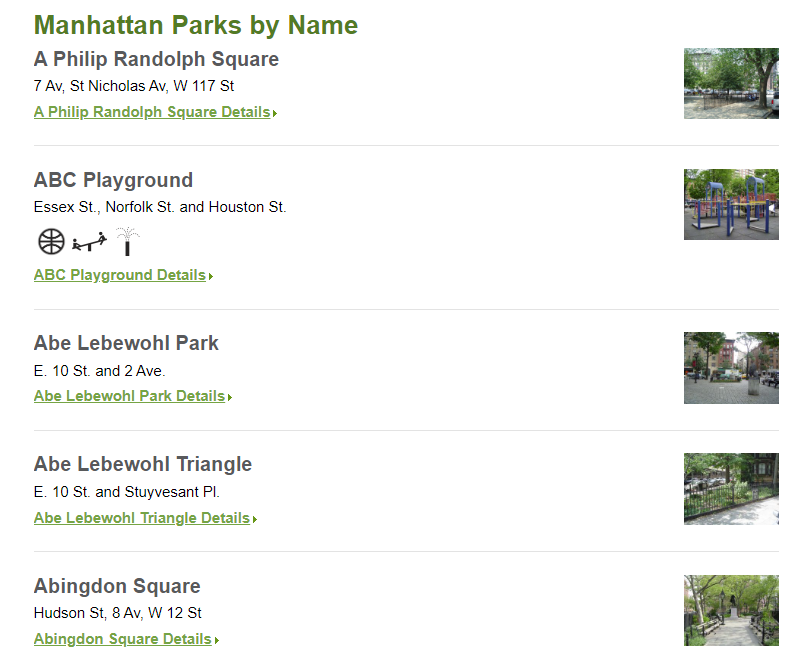
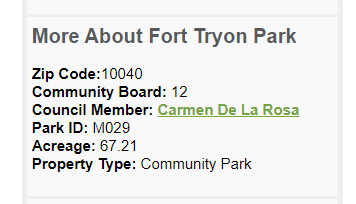
The next step was bringing in data from an outside source. I decided I wanted to get data on the size of each park so I could calculate which parks had the most squirrel density. Luckily, the city maintains a list of all NYC parks, plus photos and information including their acreage and park type at https://www.nycgovparks.org/parks
This all took longer than planned, so I didn't actually start working in Tableau until almost 1:30pm. Furthermore, I then ran into a tricky problem involving LOD (Level of Detail) calculations that I had to get help from our coach Val with. Because of this I ended up scrambling to put my dashboard together in the last hour or so, and only got a very rough and partial version done. I will have to go back and finish it when I'm on bench!
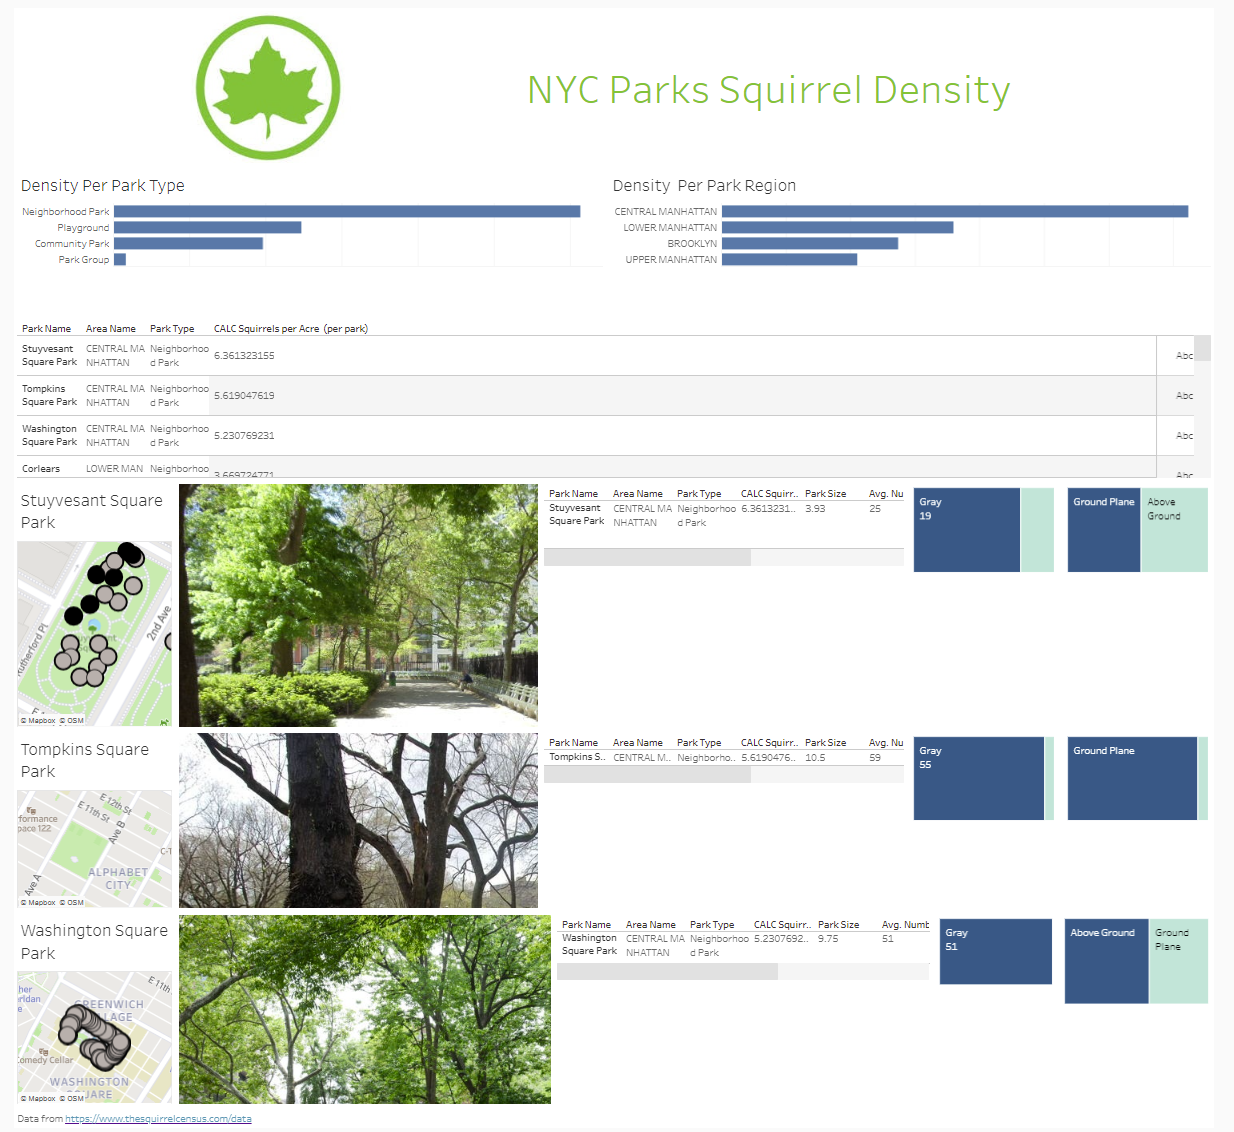
As you can see, I have bar charts showing squirrel density (calculated as squirrels per acre of land) for park type (neighborhood parks have the highest) and region (Central Manhattan parks have the highest). I then have a list of all the parks in order by squirrel density, most to least dense.
Finally, I have maps, pictures and info for the top 3 parks. It is interesting that they are all small neighborhood parks in Central Manhattan. Not only that, but they all have 'Square' in their names and are all just a couple square blocks in size. My theory is that there is less green space in this part of the city, so the neighborhood squirrels crowd into the small parks they can find.
However there are also likely some data collection issues. Larger parks have more acreage, but surveyors only counted squirrels in sections of these big parks. This leads to lower squirrel per acre metrics (small numerator, big denominator) that are smaller than in reality.
Stay tuned to https://public.tableau.com/app/profile/alan.grunberg/viz/Squirrel_Census_Dashboard/Dashboard1, I'll finish it and clean it up in the future!