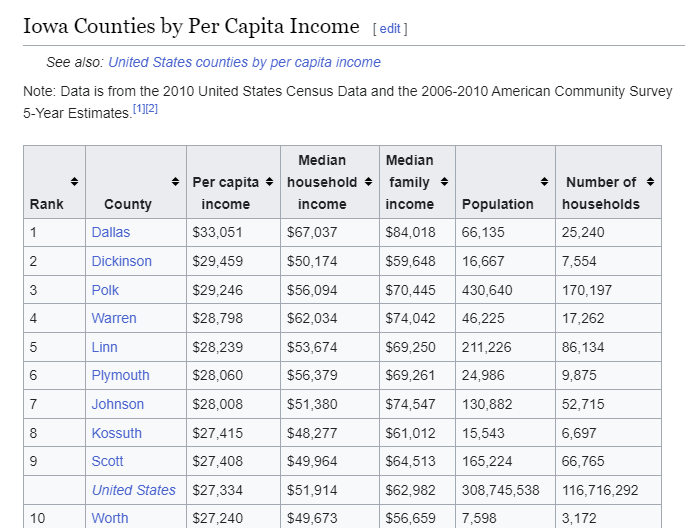
For the last day of Dashboard Week, we worked with a dataset of liquor store orders in all the counties in Iowa, plus a lookup table with the population of each county. You can access the dataset at https://data.iowa.gov/Sales-Distribution/Iowa-Liquor-Sales/m3tr-qhgy/about_data I wanted to look at the average income in the different counties as well, which I found on Wikipedia at https://en.wikipedia.org/wiki/List_of_Iowa_locations_by_per_capita_income
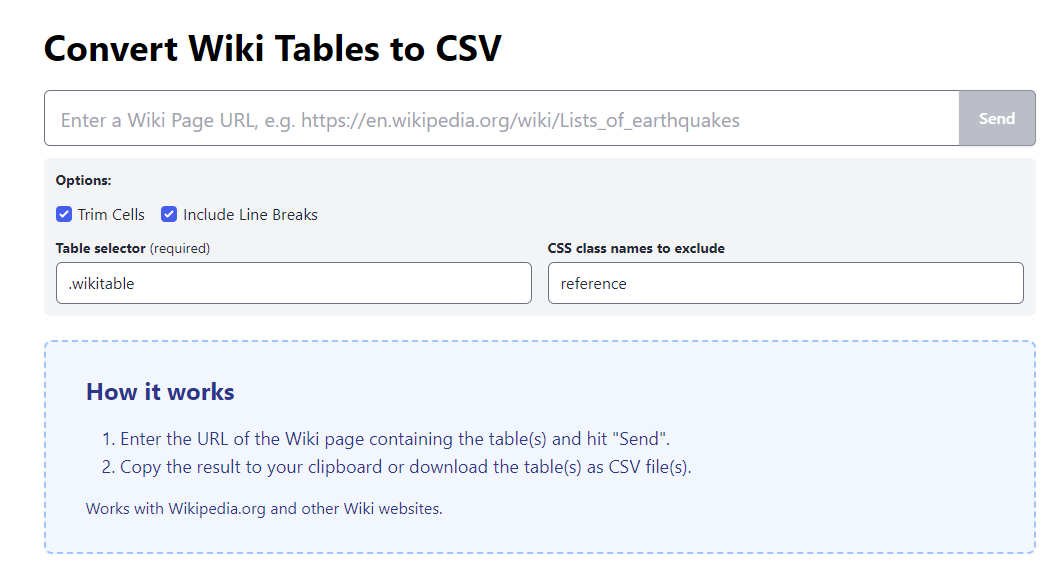
Then I found a website that allows you to easily grab tables from Wikipedia and convert them to CSV files. It was super useful! Here's the link: https://wikitable2csv.ggor.de/
I brought the 3 data sources (liquor orders, county population, county income) into Alteryx for data cleaning and data prep. It was mostly straightforward, but then I ran into a problem that took a really long time to figure out and fix. For some reason one of the county's data was not showing up on the map when I brought the data into Tableau. The name of the county was O'Brien county.
When setting up a relationship between 2 tables in Tableau, you have to pick the matching fields from each table. In this case it was the County field that joined. In one dataset they were in titlecase (like Dallas, Dickinson, Polk) while in the other they were in uppercase (like DALLAS , DICKINSON, POLK) To make the match work, I used the formula to change the uppercase names to titlecase.
This worked for all the counties except for one. "O'BRIEN COUNTY" in one table got changed to "O'brien County" in titlecase. Titlecase just turns the first letter capital. But in the other table the name was "O'Brien County"- notice the B is capitalized as well. There was no match, so this county's data never showed up!
I finally figured out the issue, so I changed to the formula to turn the title case county names into uppercase (so O'Brien County into O'BRIEN COUNTY) and voila, the data showed up. Here's the final Alteryx Flow:

Sadly this left me not nearly enough time to actually make my dashboard. I just made a rough MVP of what I planned. You can check it out at https://public.tableau.com/app/profile/alan.grunberg/viz/Iowa_Dashboard_Final/Dashboard1. Here's a screenshot:
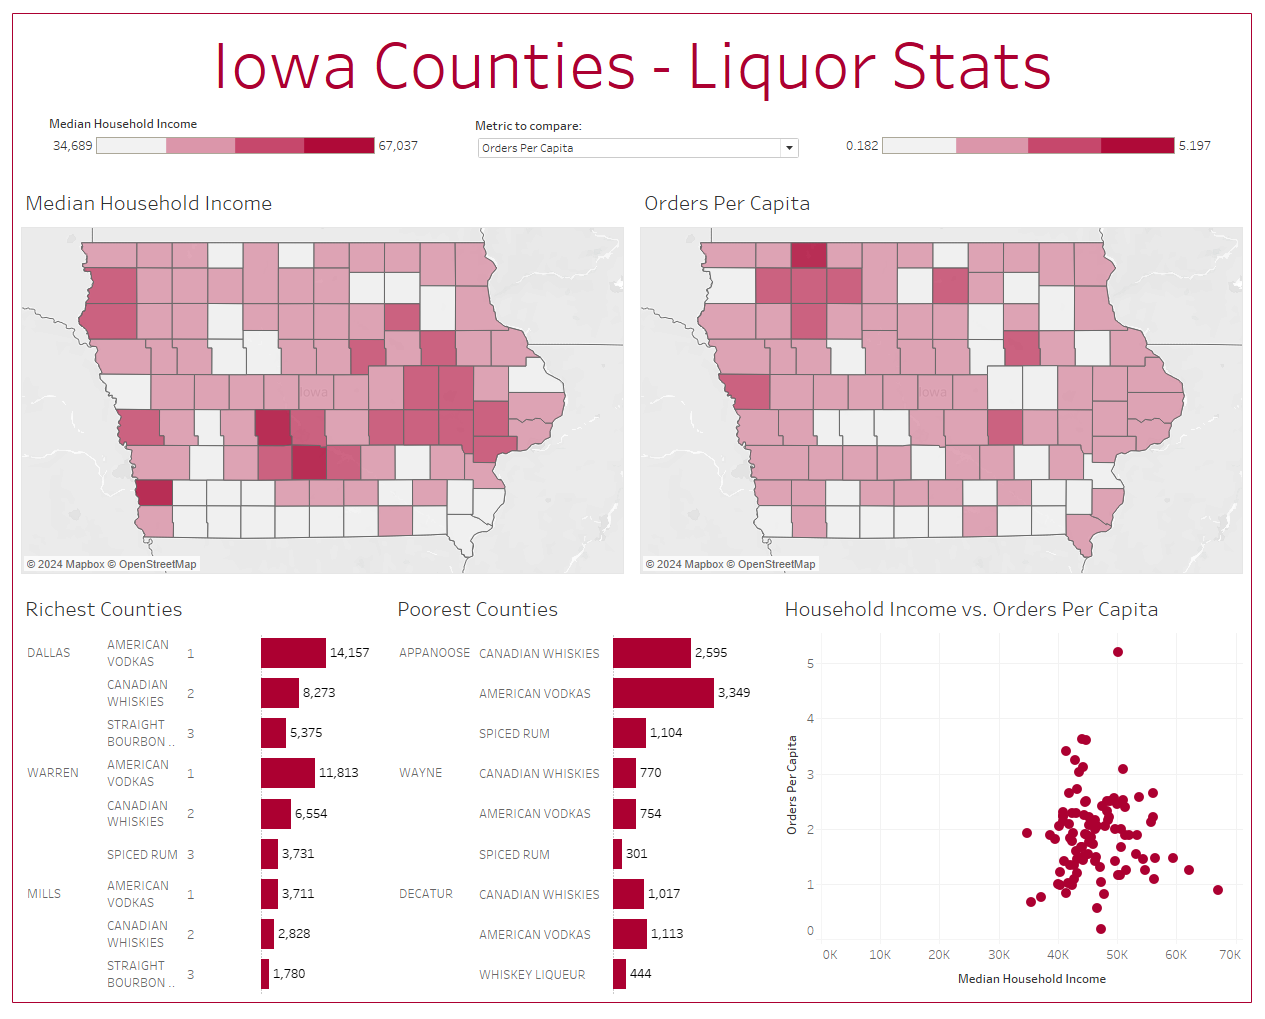
So what did I find out about the relationship between median household income and liquor consumption/habits/sales? Turns out, there barely is any. Richer counties don't drink particularly more than rich ones, and vise versa. What correlations I did find, like richer counties having fewer liquor stores per capita, were only 2 or 3 percent. (Ie: a counties wealth only explains a couple percent of its liquor store per capita total)
The one difference I did find was looking at the most popular liquor categories in the top 3 richest counties vs bottom 3 poorest. While American vodkas and Canadian whiskeys are popular in both, straight bourbon appears in 2 of the 3 richest and none of the poorest. Interesting.