Today was the first day of Dashboard Week. The dataset (from https://collegescorecard.ed.gov) was huge! Tables for each year going back to the 90s with rows on the institution level and cohort/major level. To scope down and not overwhelm my laptop/Alteryx, I chose to go with just the most recent data at the institution level.
Even then, the table had thousands of rows and thousands of columns, and Alteryx could barely handle it. To scope down further, I decided to just focus on CUNY (City University of New York) schools, and filtered the rows.
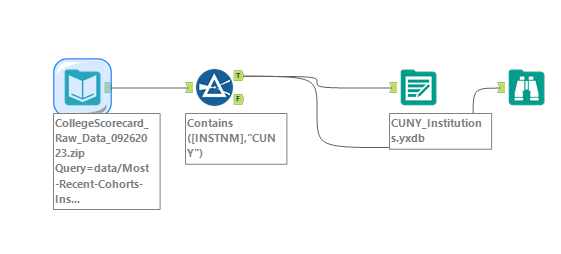
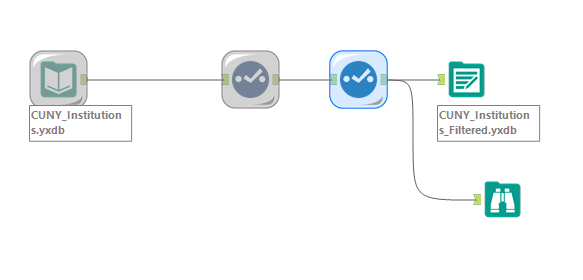
This got me down to about 20 schools, but still thousands of fields. I reopened Alteryx with just the CUNY schools, so that it wouldn't have to do too much work in a single flow. I then used the select tool to roughly filter to only the types of fields I was interested in, like earnings and demographics. Even then I was left with about 300 rows, so I filtered more finely and got down to about 80 rows, a more manageable number to bring into Tableau.
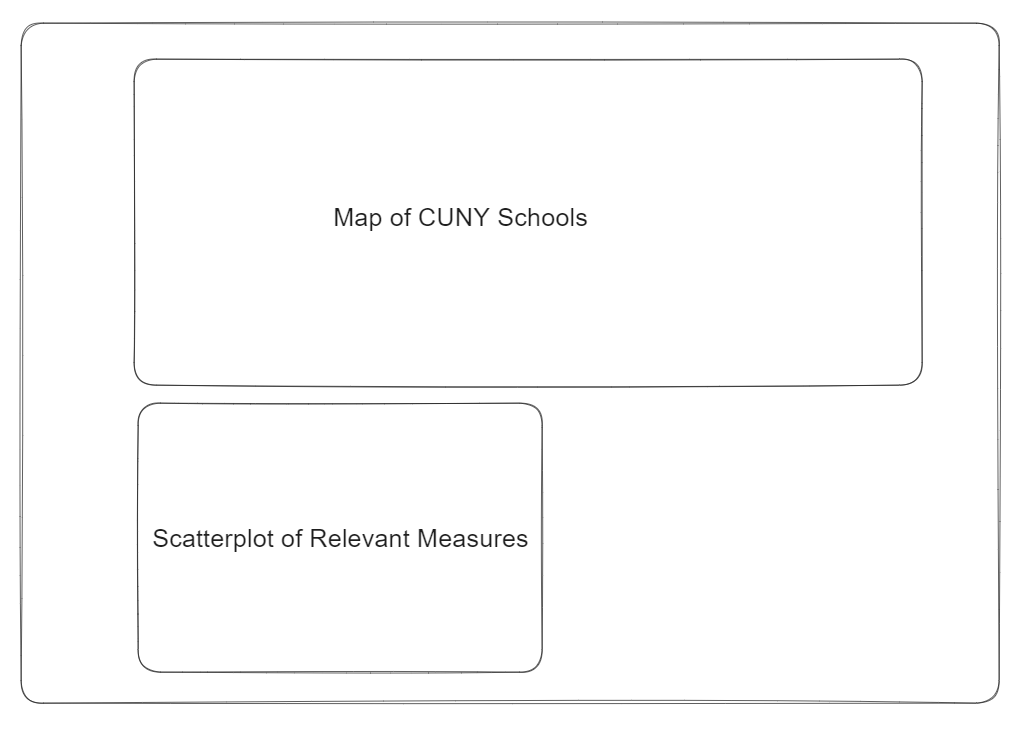
I then put together a very rough wireframe of my dashboard on Excalidraw. I just knew I wanted to have a map of NYC and a way to compare different metrics. Looking back, I would probably do this step first, as it could have helped me decide which fields to keep and which to filter out.
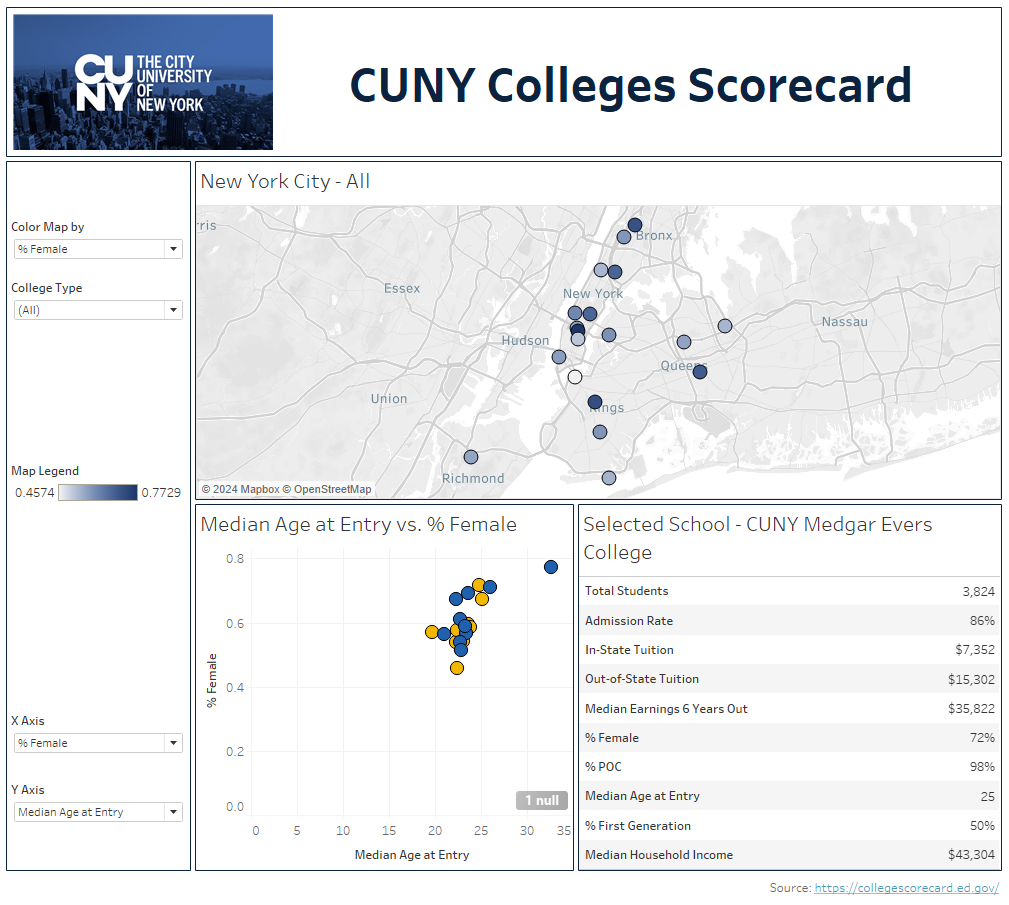
For my final dashboard I ended up using about 15 different fields. I set the map of school to be colored by whichever metric the user chooses. They have similar control over the metrics on the X and Y axis of the scatterplot. They also can filter to just show 4 year, just schools, just community colleges, or all. Finally, they can see an info card containing all the metrics for a specific school by clicking its dot on the map or scatterplot.
If I had more time, I would have liked to better format the dashboard. I'd like to include bar charts showing the top 3/bottom 3 schools for each matric. I also would have liked to look more closely at in-state tuition vs out-of-state tuition.
Thanks for reading! You can check out the dashboard here:
https://public.tableau.com/app/profile/alan.grunberg/viz/Day1-CollegeScorecard-Dashboard/Dashboard1