For the final day of dashboard week (and the final day of our training!), we worked with a dataset from Iowa open data on liquor sales at various liquor and convenience stores across the state. The main dataset includes information such as the address of the store, the brand and quantity of alcohol purchased, date of purchase, and dollar amount of the sale. We also brought in census information to connect the locations and populations of Iowa counties.
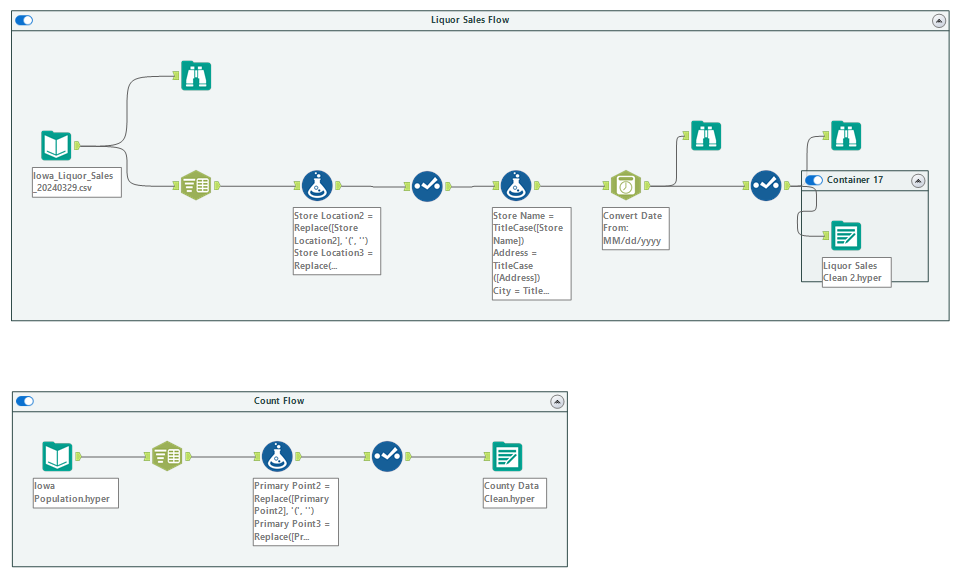
The data prep today was significantly easier than some of the other challenges this week. I started by querying the liquor sale data to include our desired date range of 2017-2019, which gave about 7 million rows. In Alteryx, I noticed that the point field that included the latitude and longitude coordinates for both datasets wasn’t in a format that Tableau would recognize.
(Format that the store points were originally in)
So, I used a Text to Columns tool to parse out the lat and long points as separate columns and used a replace function to get rid of parentheses. Aside from that, I converted the string fields from uppercase to TitleCase (moreso for personal preference / design), and since the data came in as a .csv, I converted all of the fields to their appropriate data type (including the date field which needed the DateTime tool) and exported the output as a .Hyper file.
When it came to making my dashboard, I brainstormed questions you might want to know about alcohol consumption, grouping them into the categories:
Where?
- Which parts of Iowa have the most liquor stores?
- In which counties do Iowans drink the most per capita?
What?
- Which types of alcohol and products are the most popular?
- Does popularity vary by county / region?
When?
- On which days of the week and months of the year is the most liquor purchased?
- Does the popularity of certain liquors change over time / throughout the year?
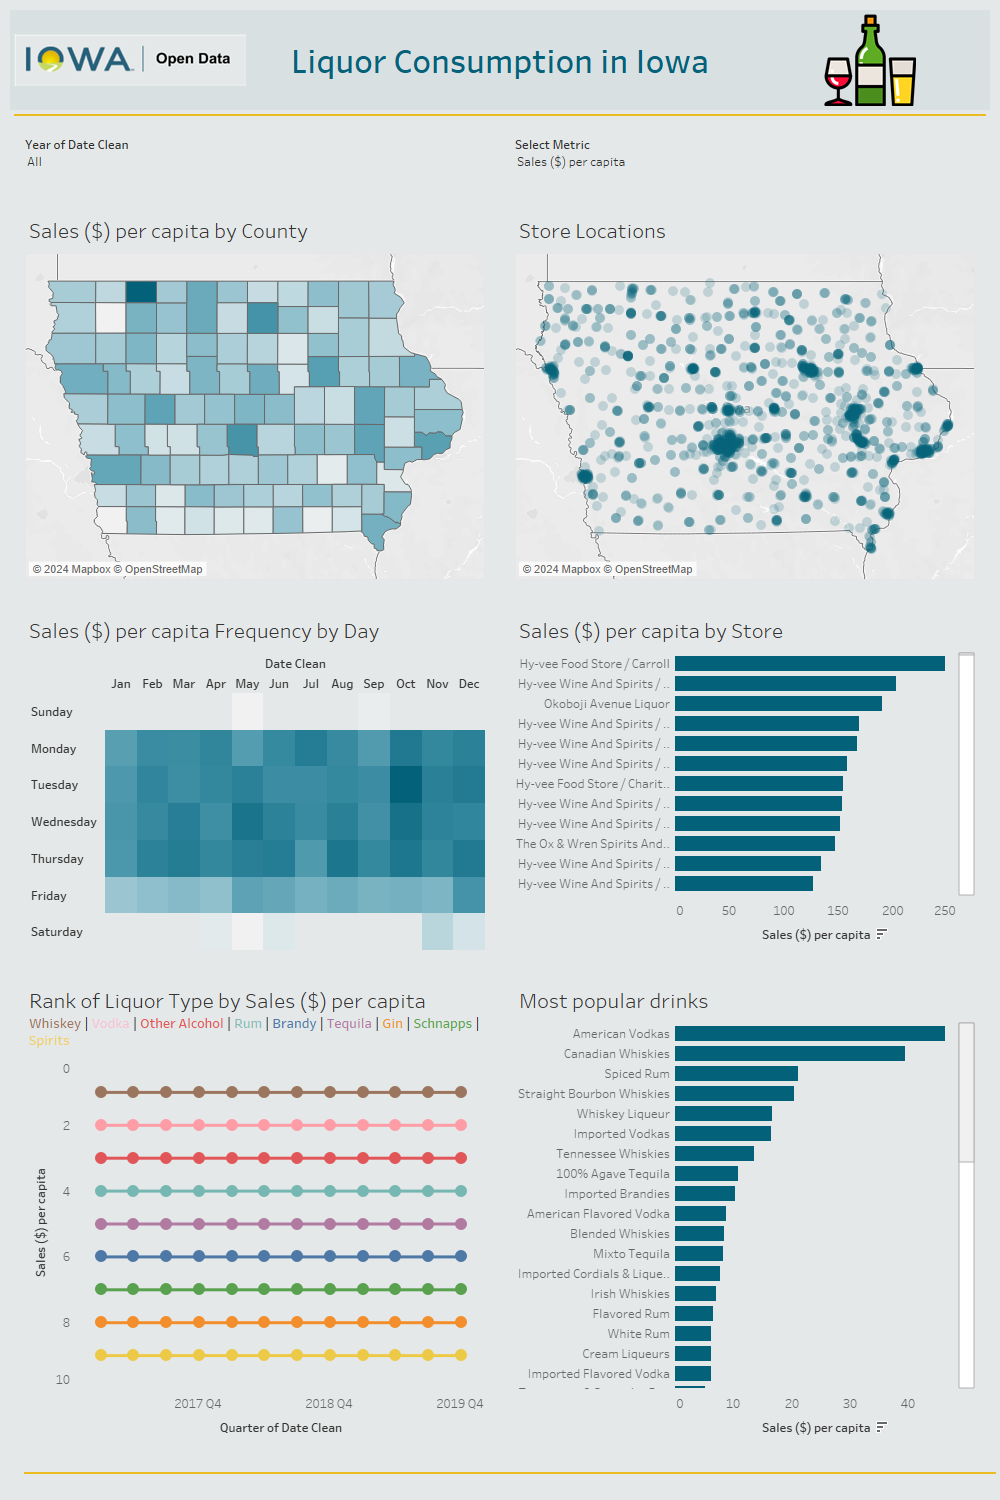
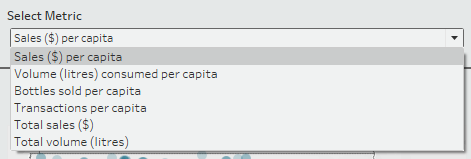
I created two charts to answer each of these questions, including a map that shows the stores in Iowa, and another map that shows liquor sales by county. Most of the charts break down by a parameter that lets you switch between the following values:
There is also a calendar heatmap of when most orders were placed, the most popular drinks and drink categories, and a bump chart that shows the rank of different liquor types (which shows change in rank over time when you select a county from the map).
This was an interesting dataset and a great way to wrap up the week.