For the third day of Dashboard Week, we were given data from NYC Taxi and Limousine Commission on taxi rides in New York City. The data contains information such as the times and locations of pickups and drop offs, fares charged, and the Taxi line associated with the ride.
The data comes from this nyc.gov link: https://www.nyc.gov/site/tlc/about/tlc-trip-record-data.page
There is a file for each month of rides, and as we were tasked with covering the whole year of 2023 we had to download 12 files from the website. The primary challenge of this project was working with .Parquet files, as this was the file type used to store the taxi ride data. Parquet files, for those unacquainted, use a column-oriented format that stores data per column rather than per row, and are structured with the schema of columns. The main advantage of the Parquet format is that it reduces query times and requires less storage space, improving performance of large datasets. This is likely why the Taxi and Limousine Commission chose to switch from .csv to .parquet files for storing their data, as each month has a few million rows representing the number of taxi rides.
However, working with Parquet files in Alteryx can be tricky, as the Input Data tool doesn’t give an option for the Parquet format, and there isn’t a simple way to read these files. The solution is to parse out the files with a python script using Alteryx’s Python Tool. In my case, I wanted to read the Parquet files from my local machine, and after a fair bit of research and trial and error, here was the Python Tool setup that worked properly:
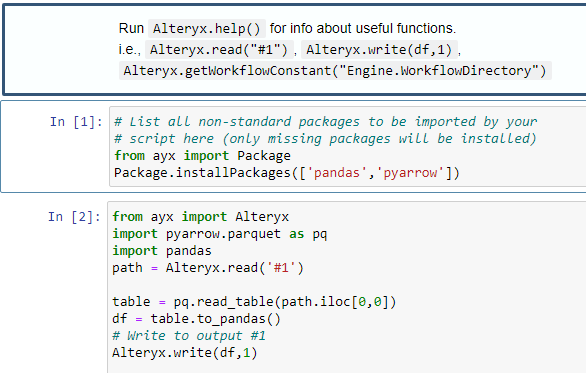
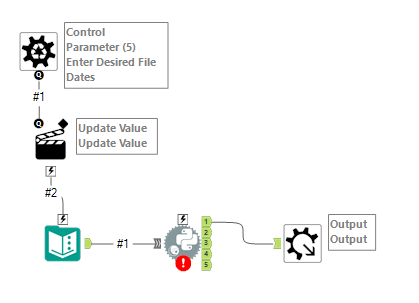
The script has to install the pyarrow package and specify the file path of your parquet file. I originally wrote out the actual file path of one of the files where it now says ‘#1’ on the path line, but later connected the Python Tool to a text input with the file path. This allowed me to create an Alteryx batch macro where the text input can be updated with suffixes for each file. In my case, the text input that I would later connect to this macro would contain values ‘2023-01’, ‘2023-02’, etc to replace the end of the file path. The batch macro would then parse out each file and union them together, giving me the final dataset for taxi rides.
I also wanted to analyze geographic information, and noticed that the main taxi ride datasets only had a location ID but included no location names or lat long points. I found a taxi zone lookup table with the names of neighborhoods and a shape file of the taxi zones that I eventually relationshipped to my main table in Tableau. Before outputting the geographic information I also used the spatial match tool to create the centroids of the taxi zone polygons so that I could have actual points to connect route lines to.
For my dashboard, I wanted to visualize taxi routes for a given pick up location. I decided to make one map that showed the amount of total rides by taxi zone (choropleth / filled map) that would allow you to select a zone to see routes for as another map. I also created charts showing trends in rides over time (one as a bar chart of total rides by month, another as a calendar heatmap that shows the most frequent days of the week and hours for rides), and finally I made a donut chart that breaks down fares into their subsequent base fare, tip, and other fees. Here is the dashboard I created:
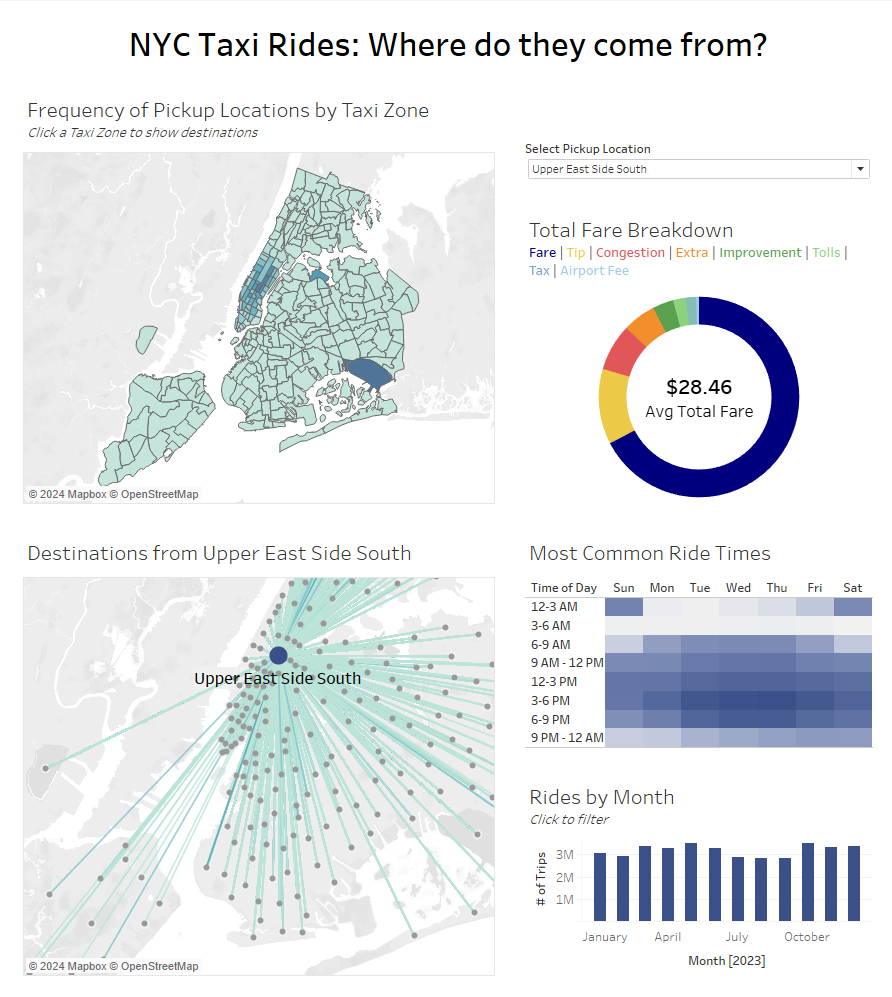
It has solid filtering and action functionality and a range of chart types. For the future, I’d like to spend more time synchronizing the color palette and polishing the design. Overall, this was a rewarding project and it was helpful to build our experience in working with Parquet files.