Today we were assigned to create an informative dashboard using the 2023 Yellow Taxi data from https://www.nyc.gov/site/tlc/about/tlc-trip-record-data.page.
I'll be updating this blog at regular intervals throughout the day with my progress and challenges so far.
10:30 am
The main problem so far has been that the datasets are in .parquet format, which Alteryx doesn't have native functionality to handle. Using my Google-Fu, I found a blog on the Alteryx community called "Parquet, will it Alteryx?" to help. It gave the following instructions:
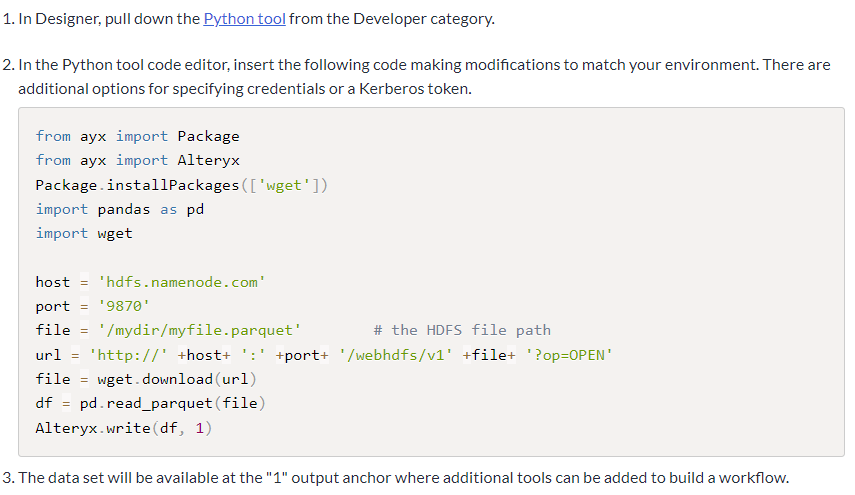
I made a few mistakes using this, and sought help from Le Luu, our resident Python expert. Here are the pitfalls I encountered and how I overcame them:
- I didn't understand the 'host' and 'port' variables, so I just ignored them. I set the first instance of 'file' to the local filepath on my PC
- Later, I realized that the 'file' variable is used with 'host' and 'port' to construct a URL, and the .parquet file is downloaded from the URL.
- With that in mind, I deleted all the variables except for 'url' and the second instance of 'file' and pasted in the URL from the TLC website where the .parquet file is hosted.
- I also had trouble because the code relies on the pyarrow package, but this was not installed.
- Le showed me that I could just add 'pyarrow' into the brackets on the line that said 'Package.installPackages(['wget'])'
- It should be noted that in order to install python packages, you need to be running Alteryx as administrator. In order to do this, with Alyeryx closed, right click on your Alteryx icon and choose "Run as Administrator" and then click "Yes" in the dialog box that appears.
Here's what the configuration of my Python tool looked like for one month's datafile:
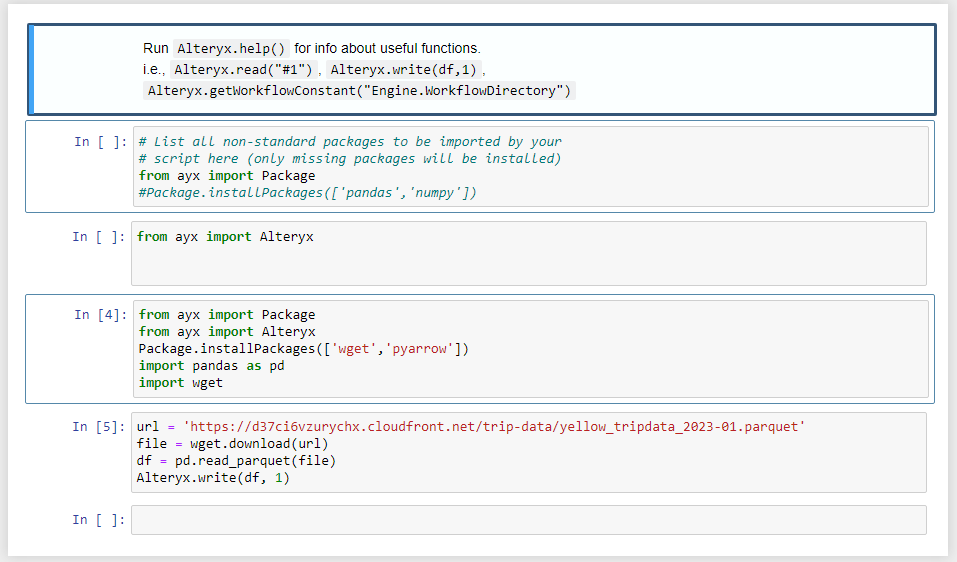
I have to repeat this 12 times, changing the URL each time, to get the full year. If you need to do this for more files, I suggest creating an iterative macro. Ultimately, I will union all these files together and exported a .yxdb.
11:30 am
The Python tool is EXTREMELY SLOW. My data is finally outputting, and then I'm going to check it out in Alteryx, do any more prep needed, and output a .hyper to use in Tableau. While waiting for my flow to run, I've been checking out the data dictionary and to understand the structure and think about what fields I might want to use.
12:30 pm
The file for the whole year has almost 40 million rows, so each step in the Alteryx flow runs very slowly. I wanted to update fields to have actual string values instead of numeric codes as well as join the shapefiles onto the trip data twice (once for pickup and once for drop off) but each step was taking so long that I decided to do most of that in Tableau using relationships and calculated fields. Currently, my Alteryx flow is running to output the .hyper files. It's time for lunch but I'll probably work a bit during the lunch hour.
2:00 pm
After lunch, I had my .hyper files. I tried during lunch to join them in Alteryx as I had originally wanted, but this was taking too long, so I just relationshipped them in Tableau. Now I'm building my charts. I'm aiming for two charts so that I have time to format my dashboard--the past two days, I spent minimal time formatting, so my personal goal for today is to make sure the format is nice even if the dashboard isn't as comprehensive as I might like. So far, I've got a dynamic map that I'm messing around with. I'd also like to make a marginal histogram.
I noticed a neighborhood in Staten Island had an average tip rate of 80%, so I looked further into it. I saw that there were only 2 trips from this neighborhood, so I decided to filter out neighborhoods with fewer than 10 pick-ups and drop-offs.
2:30 pm
With my dynamic map and the components of my marginal histogram, it's time to start building my dashboard. If time allows, I might add some BANs or more interactivity, but my priority with an hour until presentation time
3:30 pm
Even leaving an hour for formatting and writing up analysis, my dashboard is still not where I'd like it to be. Again, I'll be finishing this on bench or as a personal project. However, I am proud of my ability to tackle new situations, as evidenced by working with the .parquet files this morning, as well as challenging myself to try a new chart type by making a marginal histogram.
See my work here: https://public.tableau.com/app/profile/cecily.santiago/viz/TipsTaxis2023WIP/Dashboard1