In a previous blog, I explained how to create a bar in bar without hardcoding dates.
(https://www.thedataschool.co.uk/valerie-madojemu/creating-bar-in-bar-chart-without-hardcoding-dates)
Here I'm going to explain how Tableau can automatically update a bar in bar chart, using a Level of Detail expression LOD. This allows your worksheet to be dynamic.
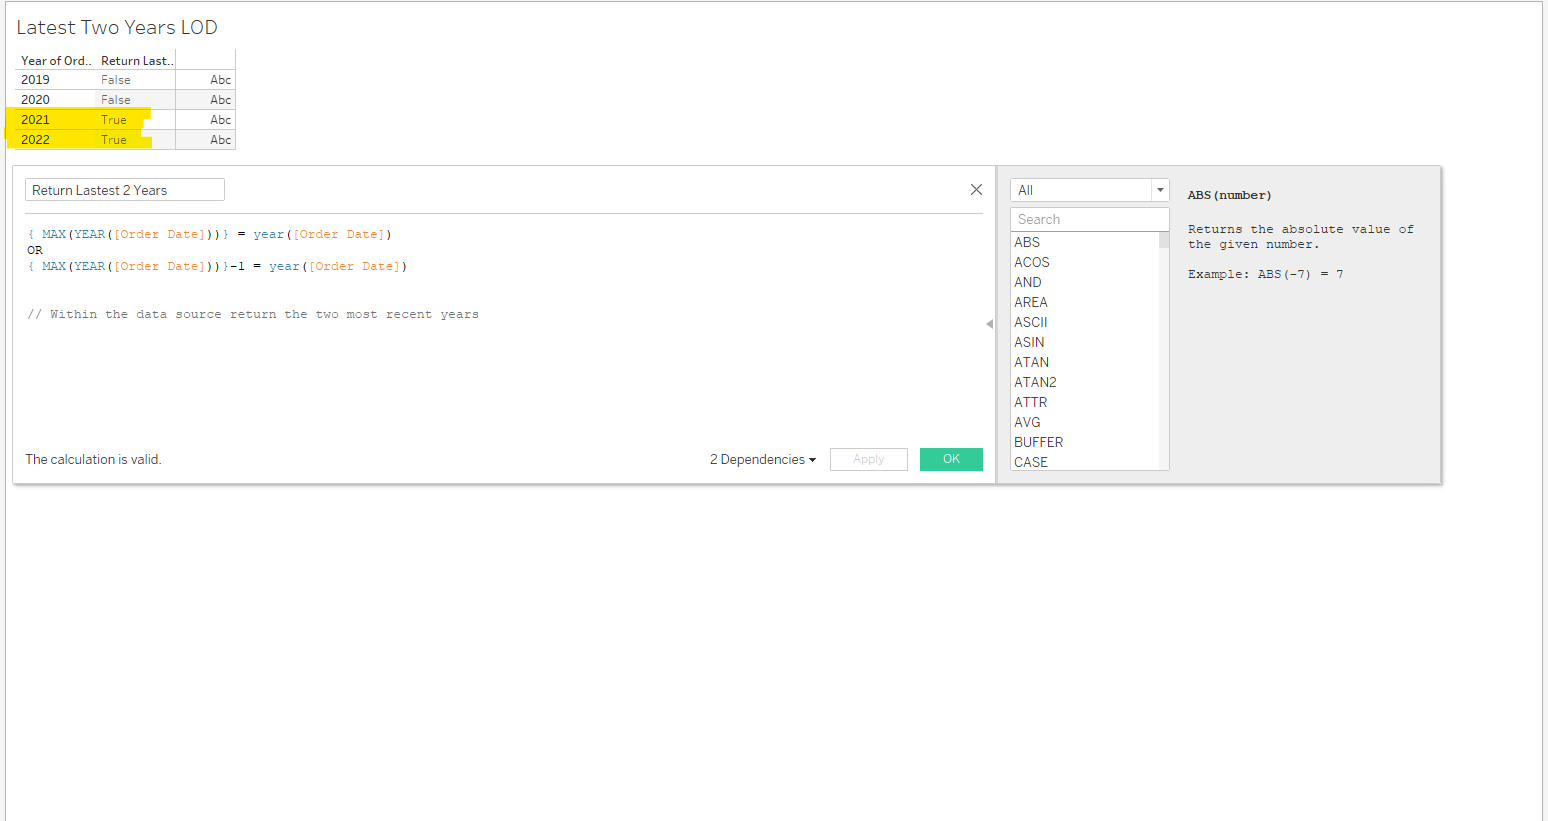
Firstly I am going to create a LOD that returns the most 2 recent years' from the datasource in Tableau.
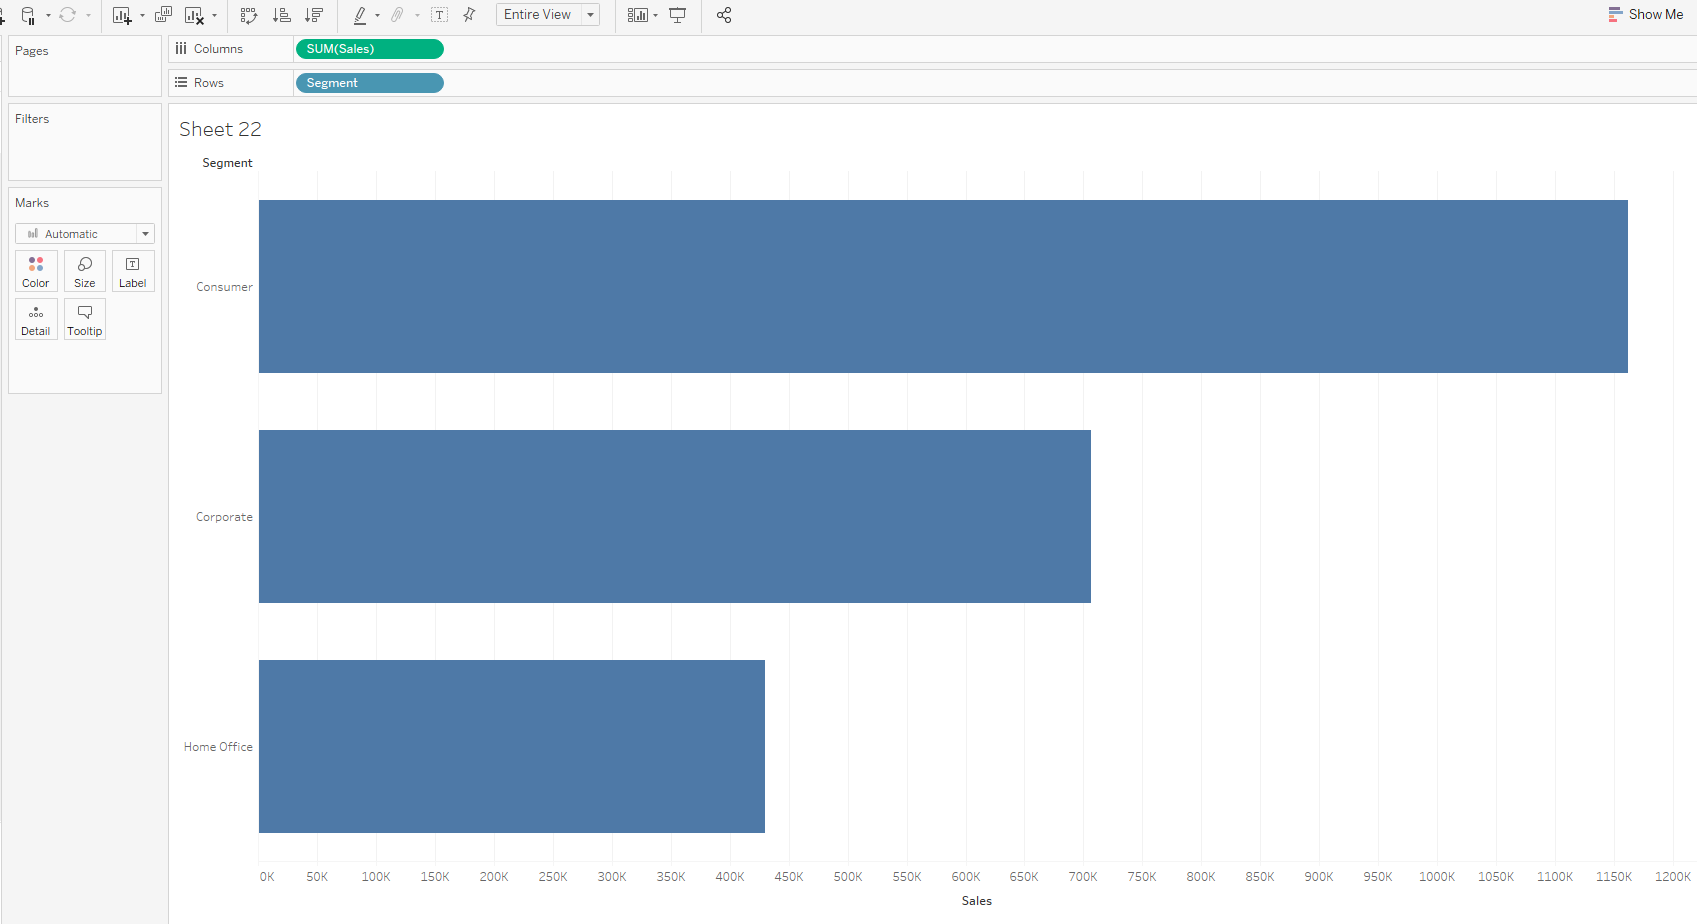
Next, I'll add Sales (Measure) to Columns and Segment (Dimension) To Rows.
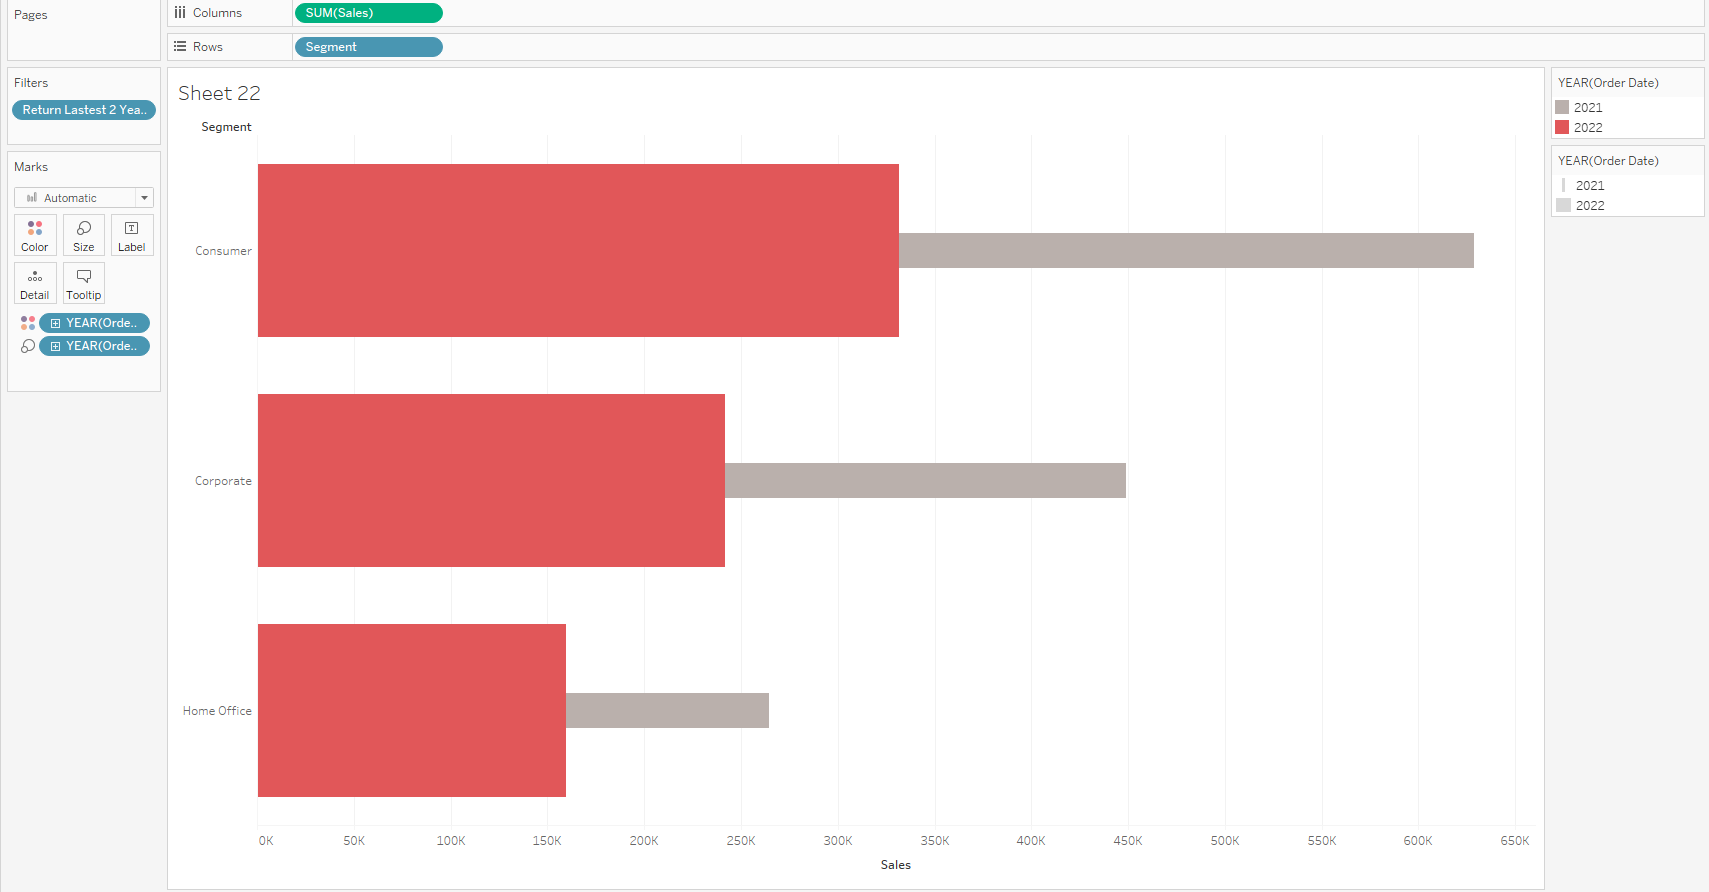
Then I Dragged the LOD calculated field onto the filter and selected True

After I Right-Clicked Order Date and put it colour card and selected discrete year

While holding the CTRL button, click on Year(Order Date) on the marks card and drag to size
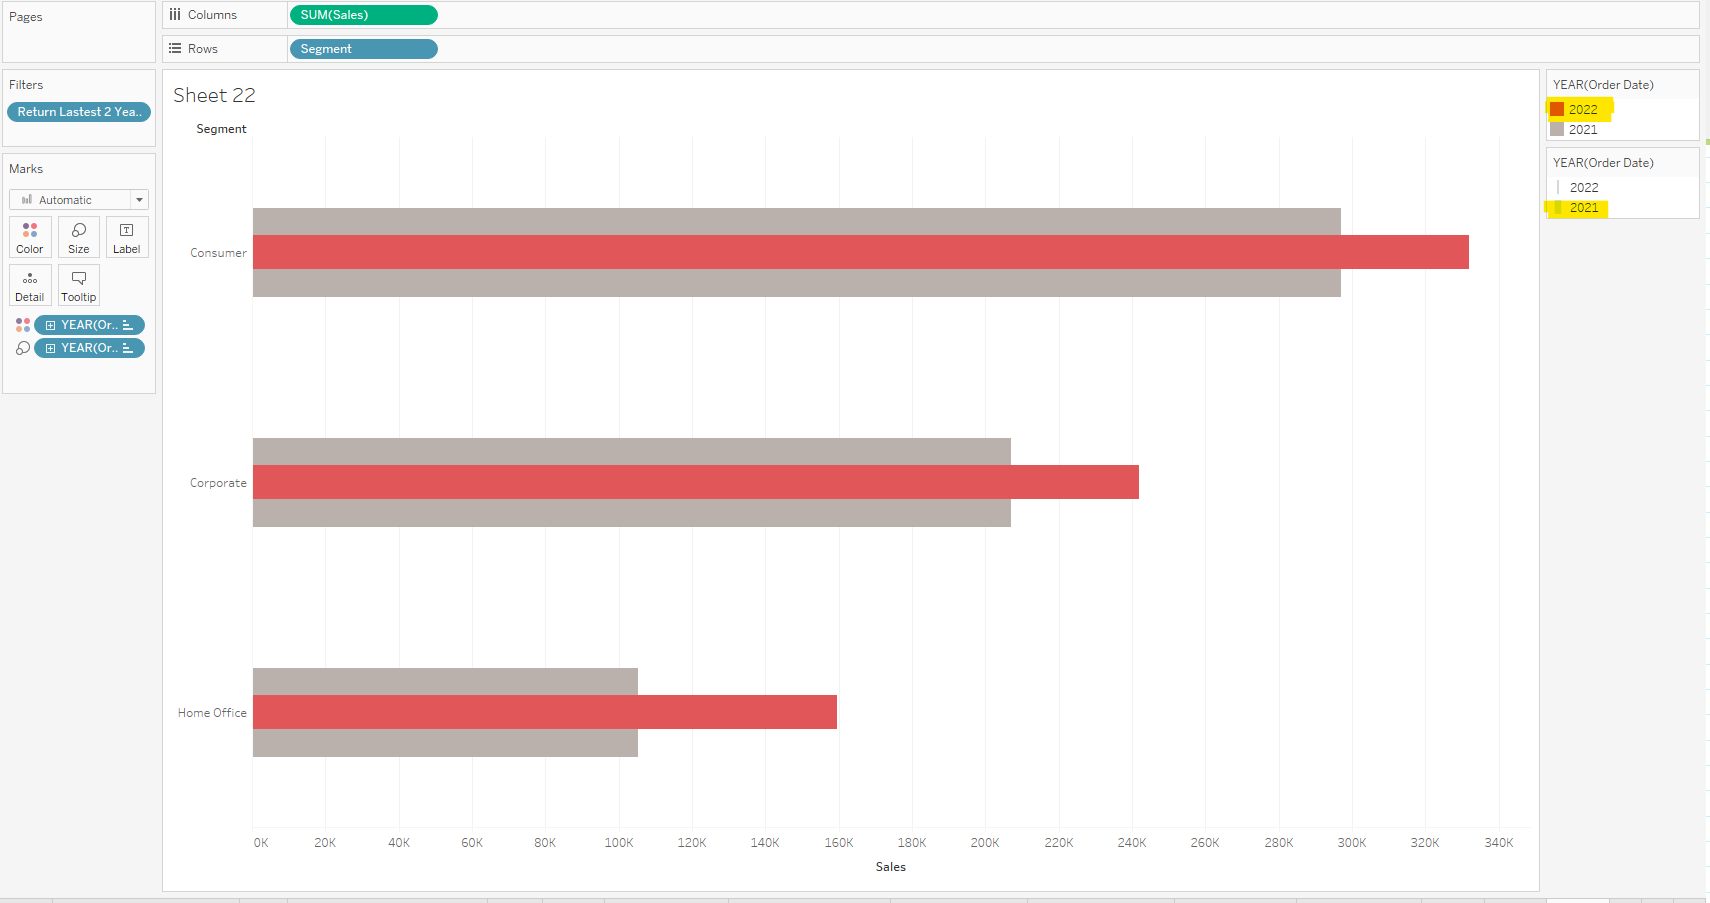
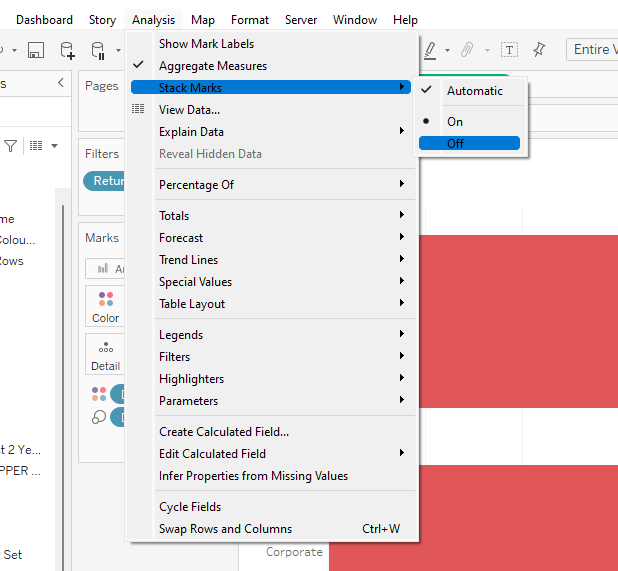
I went to the analysis tab, and turned off the stack marks
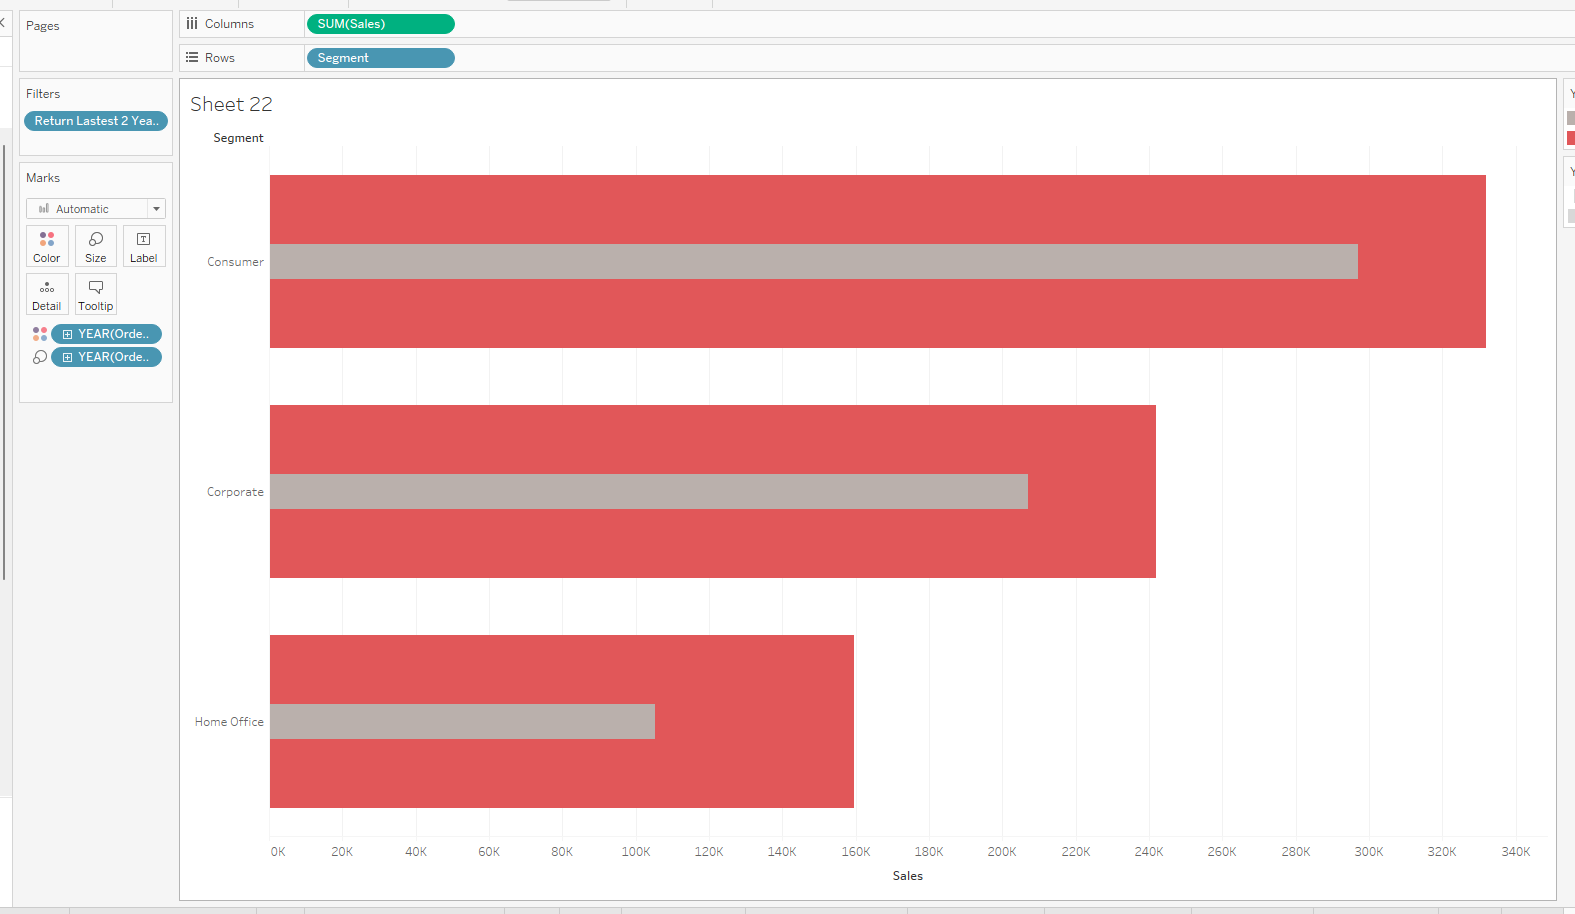
On color legend I swapped the years according to which bar (year) I wanted on the top - e.g. I prefer to have the prior year as the bigger bar in the background and the current year as the smaller bar.
You can also adjust the color and size of the bars with the legands on the right hand side of your worksheet