Before joining the data school, I made a bar in the bar by hardcoding dates
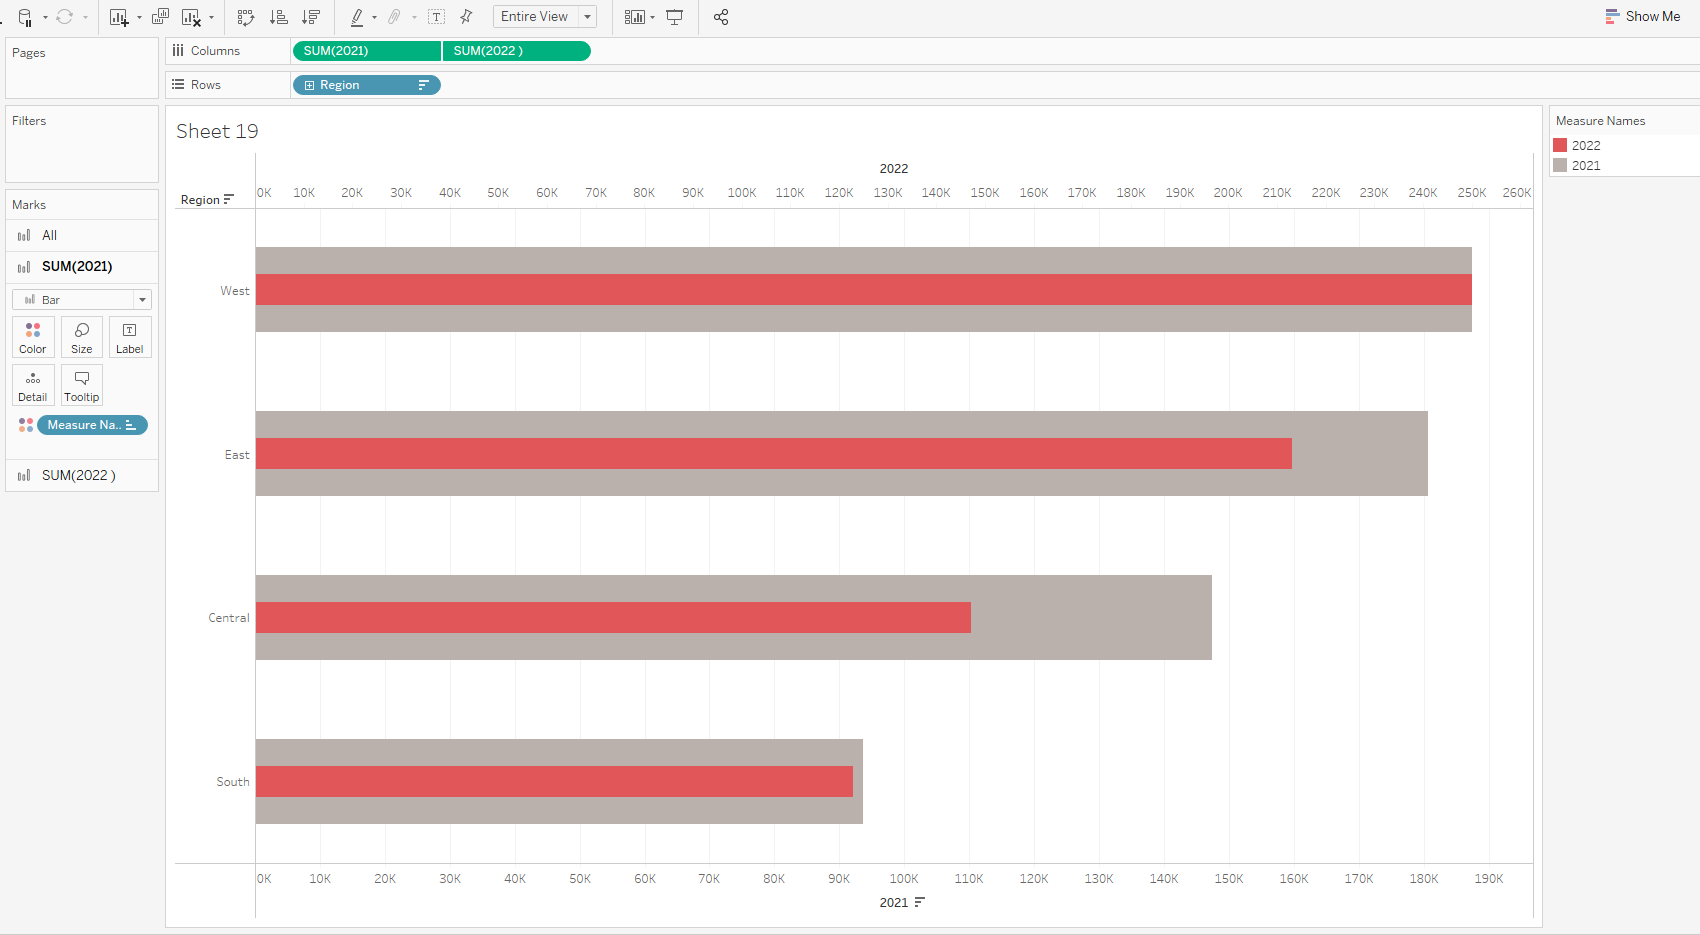
E.G. if I wanted to compare 2022 and 2021, I would create 2 calculated fields
- If DATEPART('year',[Order Date])=2021 then [Sales] end
- If DATEPART('year',[Order Date])=2022 then [Sales] end
With these calculated fields Tableau would only return sales for 2021 and 2022.
I’d then create a dual-axis graph to produce a bar in bar chart.
With these simple steps I can break away from hardcoding and also select the two years I would like to compare
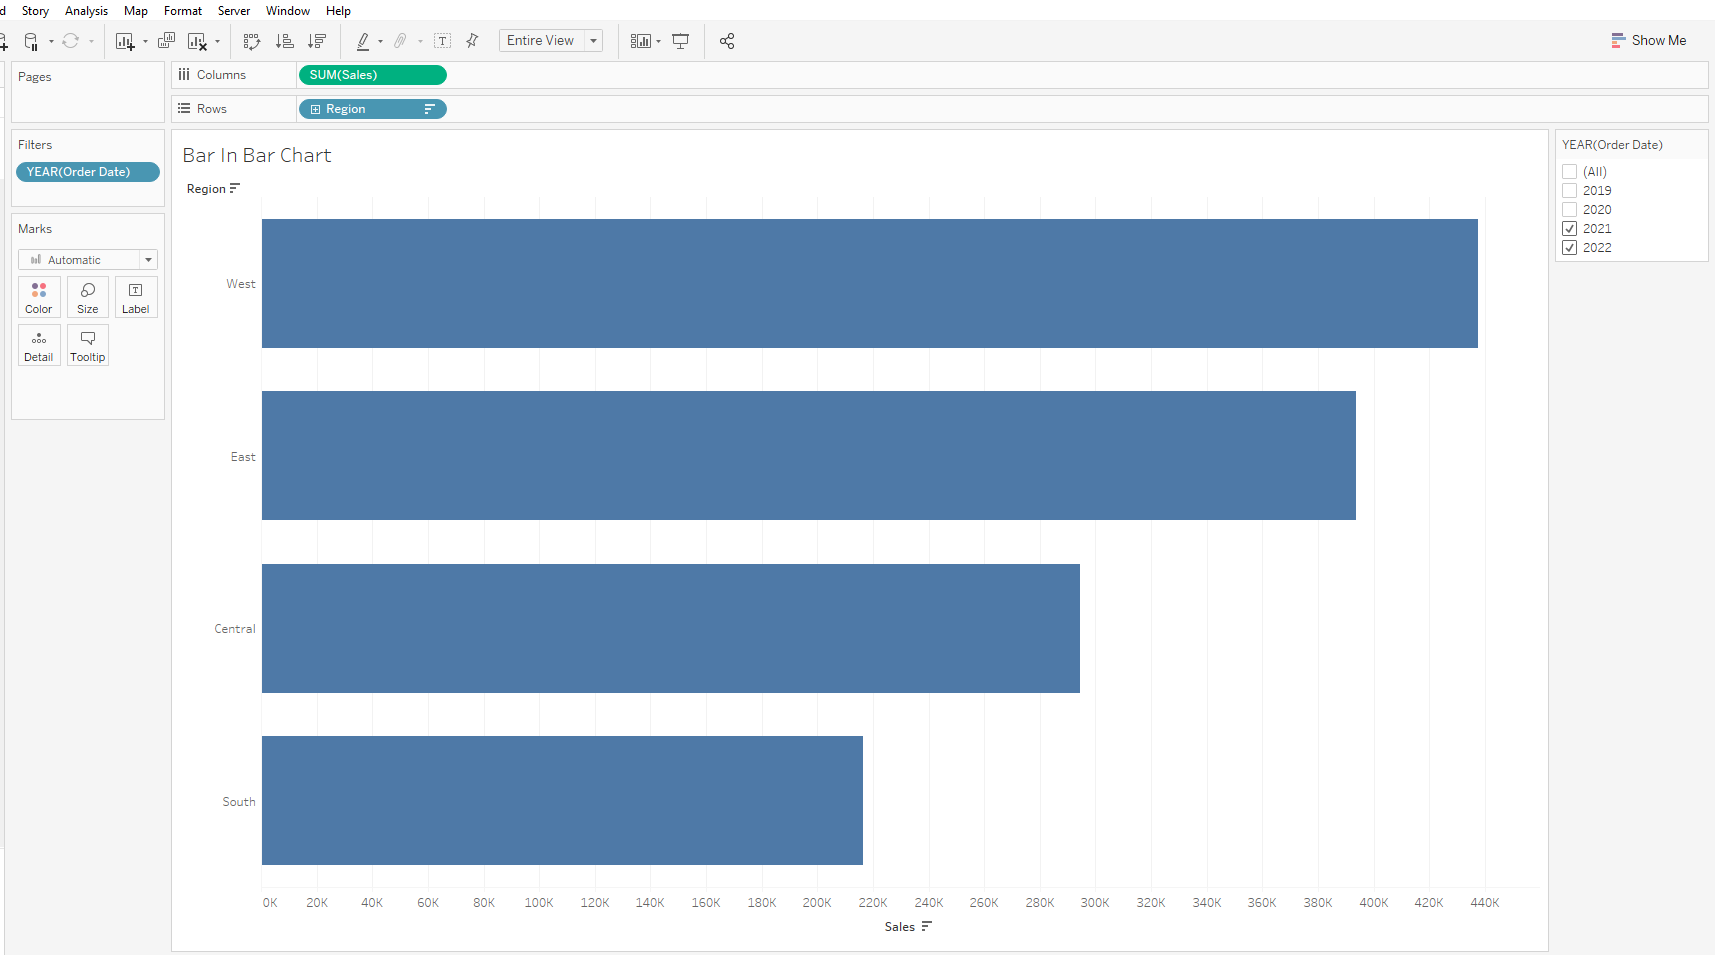
Firstly add Sales (Measure) to Columns and Regions (Dimension) To Rows.
Then Right-Click Order Date (Date Field) onto the filter- select discrete year (select 2 years to compare), click ok and show filter
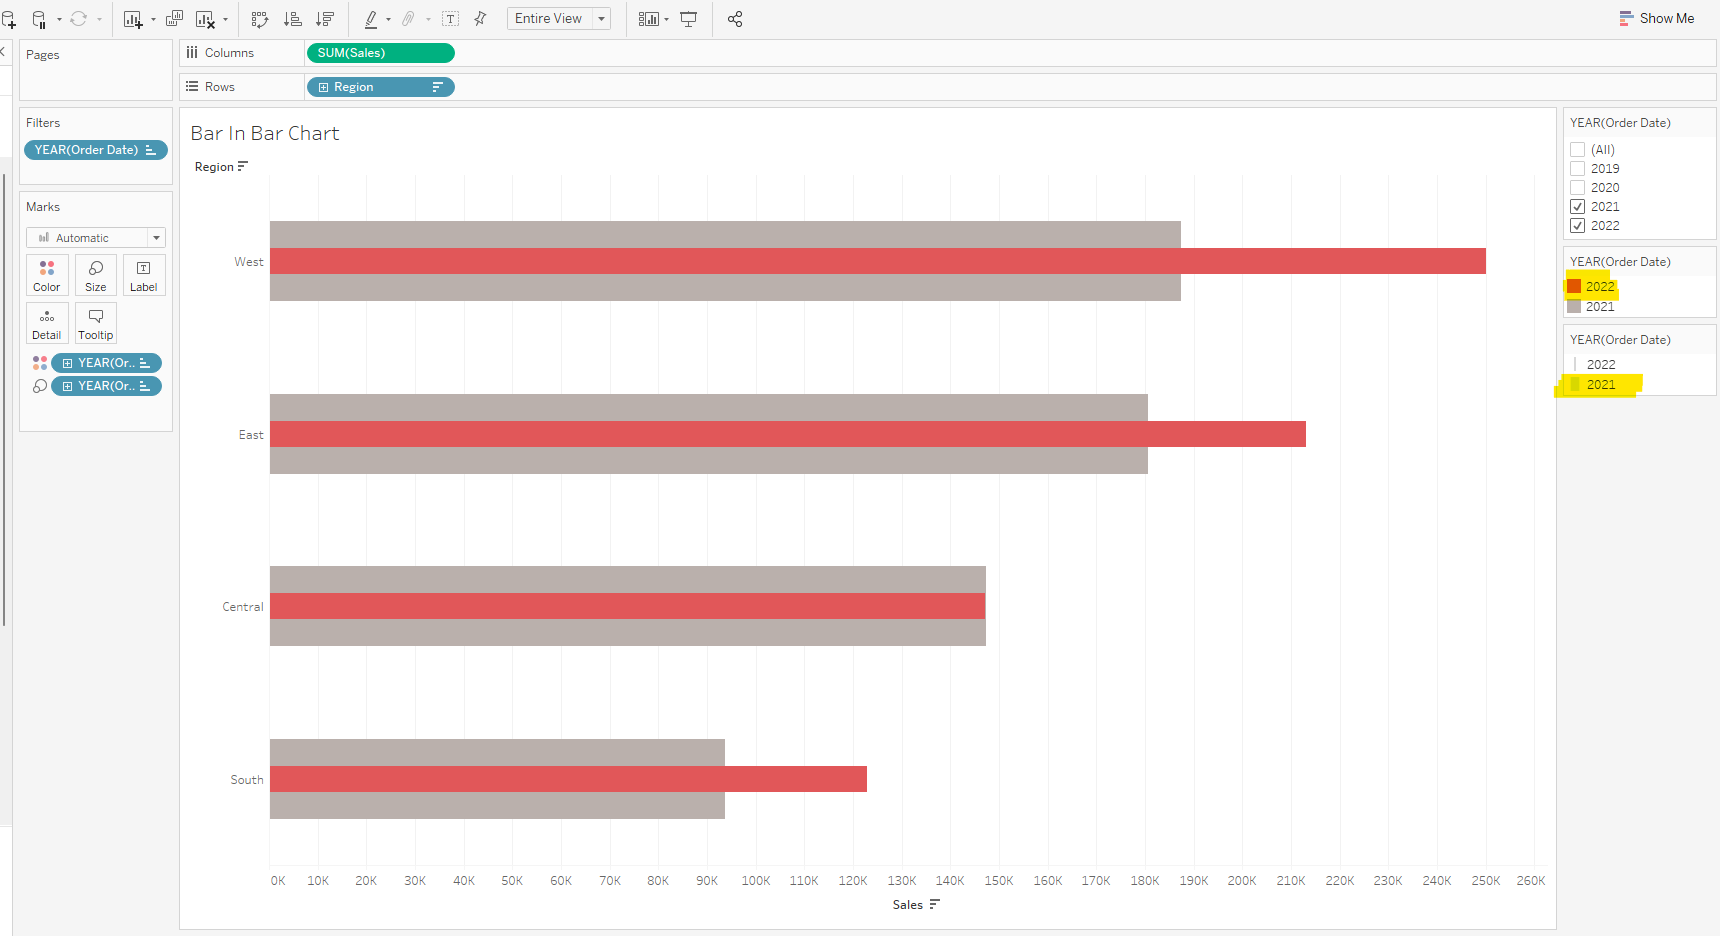
Again Right-Click Order Date but this time onto colour and select discrete year
While holding the CTRL button, click on Year(Order Date) on the marks card and drag it to size card
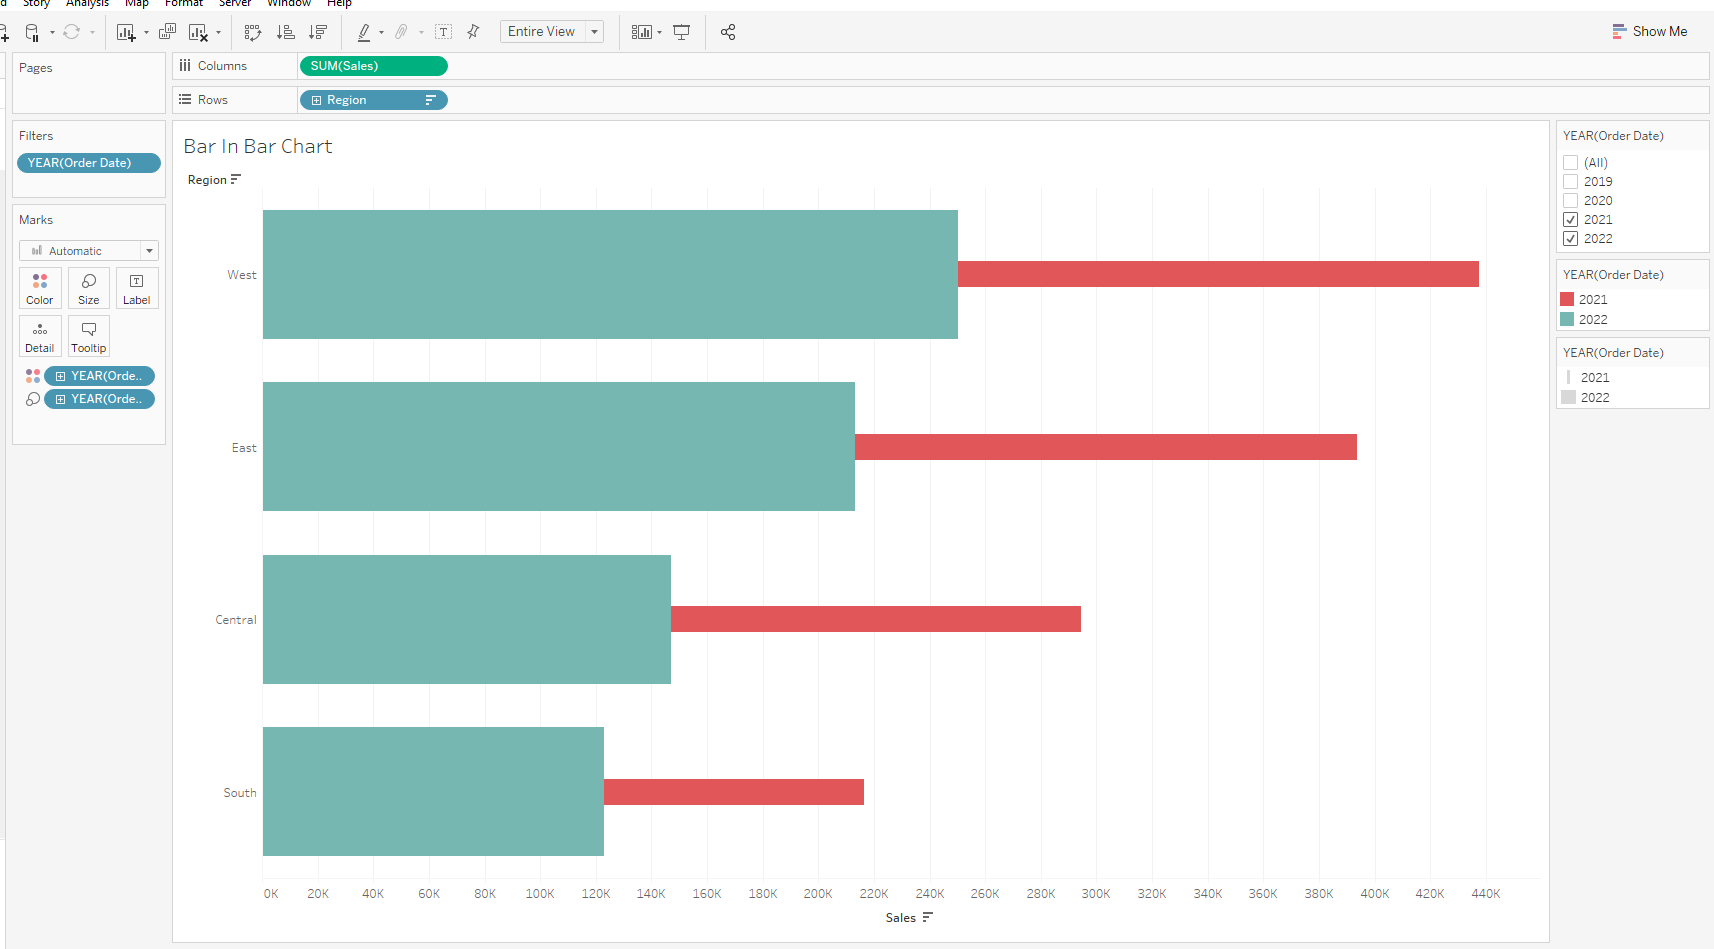
Go on the analysis tab at the top - click on stack marks - turn off

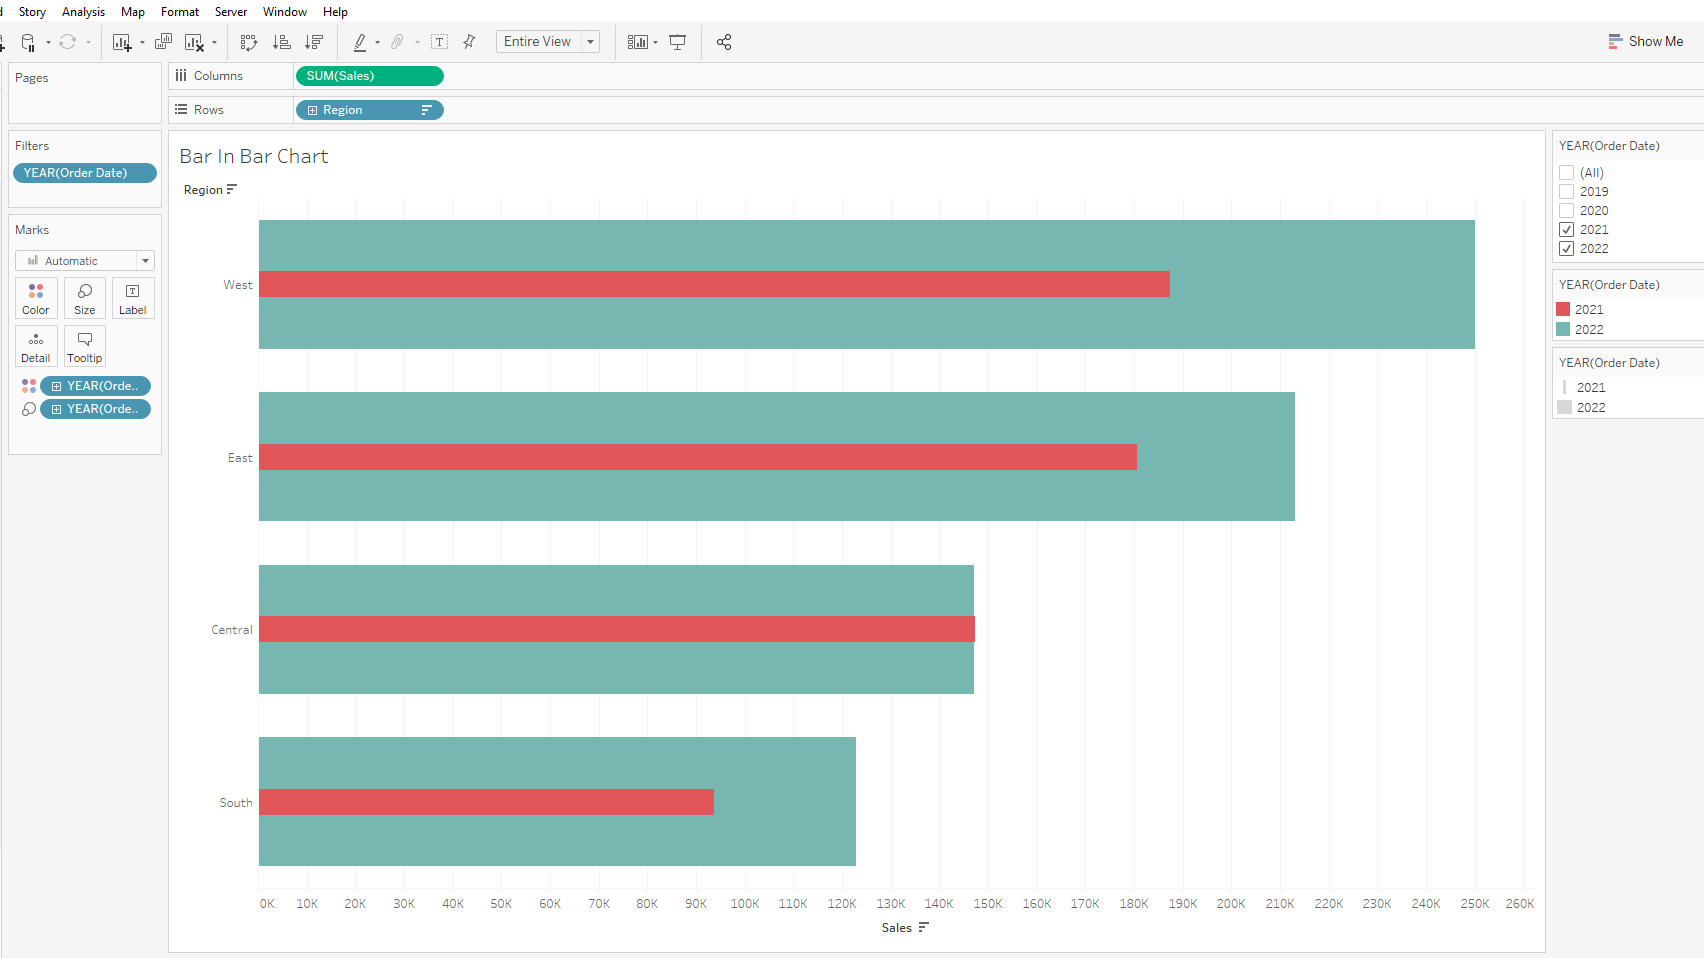
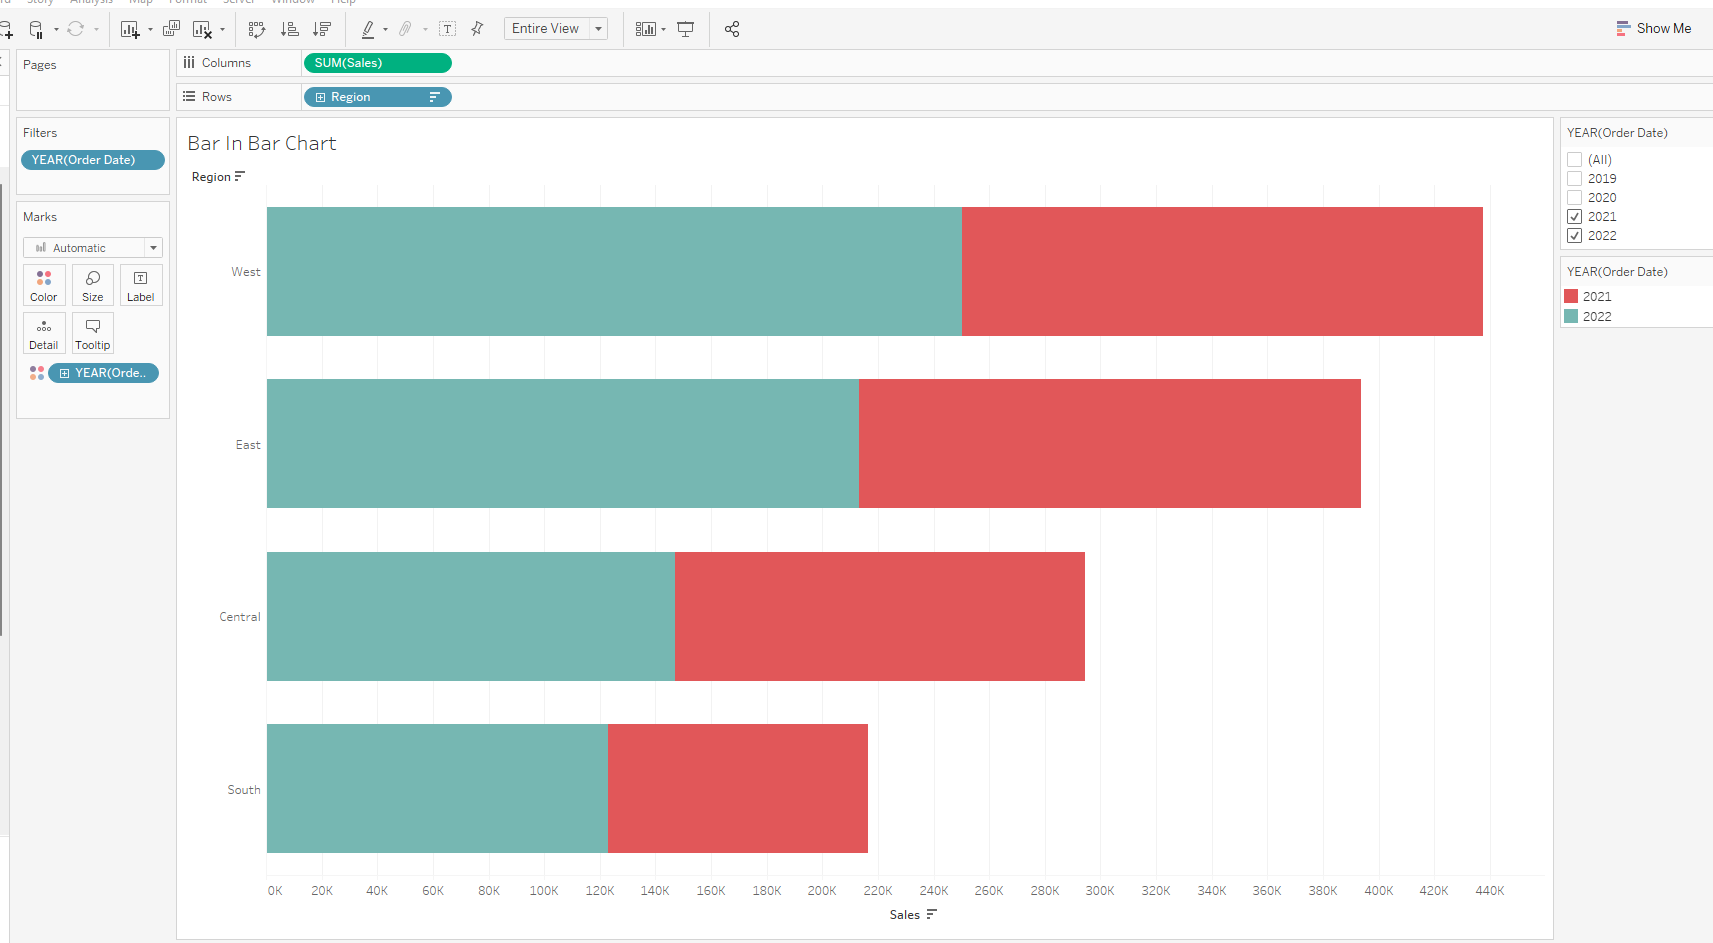
On colour legend swap the years according to which bar (year) you want on the top - e.g. I prefer to have the prior year as the bigger bar in the background and the current year as the smaller bar.
You can also adjust the colour and size of the bars with the legends on the right-hand side of your worksheet