


So you're using the WriteBackExtreme Infotopics extension and you want to know how it works? Welcome to my WriteBack Blog! We recently did a client project for Apps for Tableau involving their extensions and this is how I used it in my dashboard. First things first, let's talk about what it does.
What does it do?
Basically, WriteBackExtreme lets you interact with a Tableau dashboard in a different way, you can now edit or add new data directly in the dashboard.
So now we can use Tableau as a planning tool. Users can add new data and simulate situations, or they can test out little changes to see how these decisions could impact their key metrics all without leaving Tableau to edit the data source.
How does it work?
It's one of Apps for Tableau's extensions and it basically connects your dashboard to another backend database.
From the Tableau workbook you can connect to WriteBackExtreme on the dashboard and then users will be able to enter new values or edit existing ones and those changes are saved to the database, and Tableau will update the visuals according to the changes.
Why is this useful?
This extension is a great planning tool or can be used for forecasting or testing out changes. Not only can multiple users edit and adjust the numbers in Tableau, but it helps them try out different scenarios without changing the raw dataset. An added bonus is you don't have to go into Excel or anything to make edits and then export and re-import the data, it's all done in Tableau!
Coffee Shop Use Cases:
In our recent client project, we used coffee shop data to demonstrate how a manger could plan and forecast using WriteBackExtreme. I created two schemas, one to change the unit cost of a product, and one to simulate a promotional discount.
Unit Cost Simulation
For the Unit Cost schema I created 5 fields: Unique ID, Product Name, Original Unit Cost, New Unit Cost, and Comment.
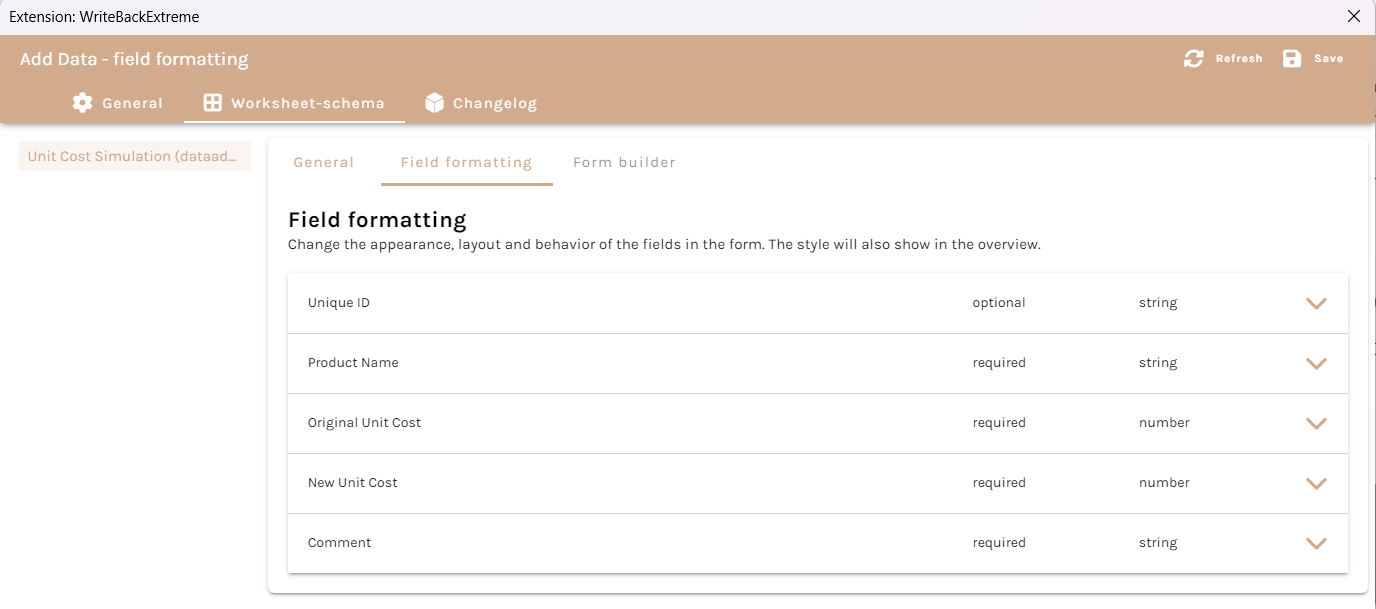
Not all of these are necessary but for my user story, the coffee shop manager wanted to be able to suggest a new unit cost for a certain product and add a comment to it.
If you want the product name and current unit cost to automatically populate, you can edit these fields so that they're dynamic.
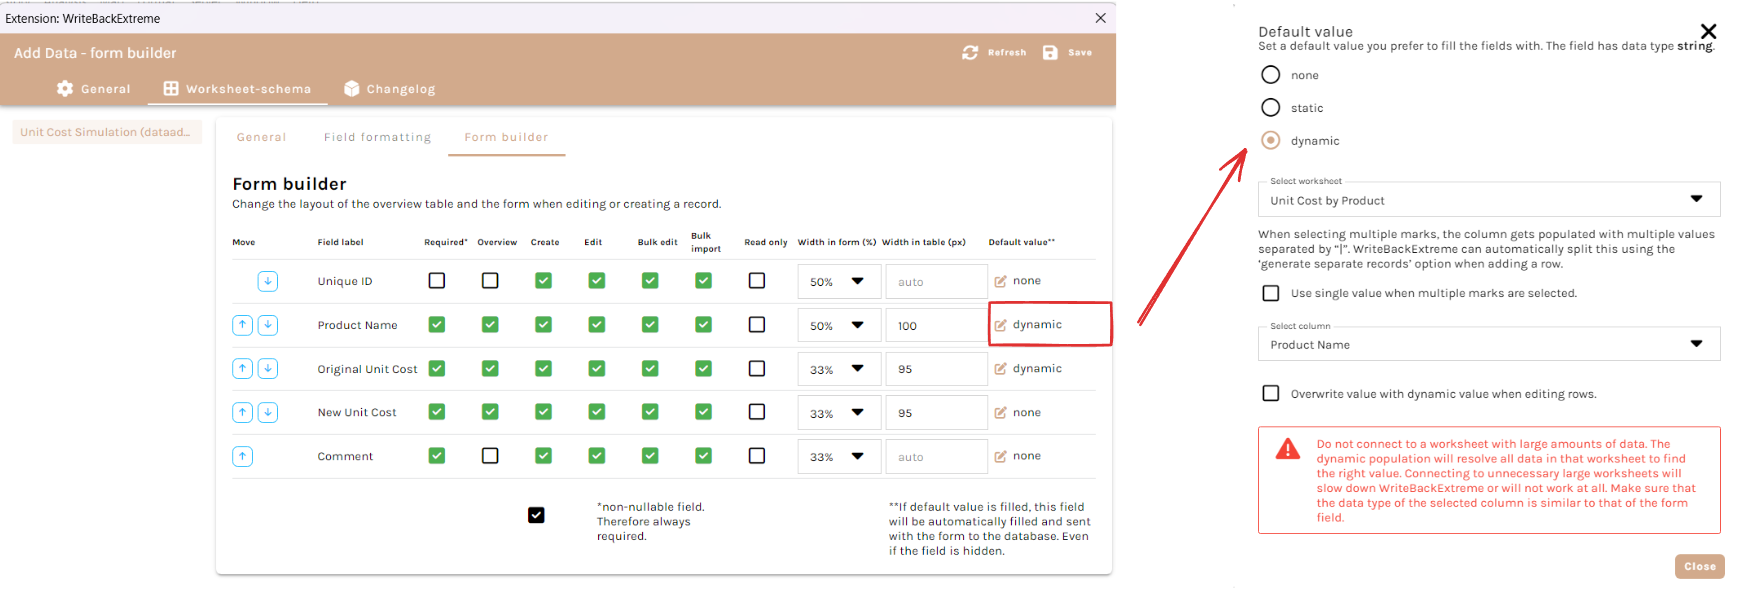
So in the form builder, under "Default value" change it from none to dynamic and then select the relevant worksheet and select the column you would like it to pull the data from. In my case, this is supposed to be adding data to my Unit Cost by Product chart and I'd like both the Product Name and Unit Cost to autofill.
Here's how it looks in the dashboard:
As a manager, I might want to see what changing the unit cost would do to my projected sales for the following month.
So using WriteBackExtreme, we changed the unit cost of an oatmeal raisin cookie and it will show the new cost on the bar chart and will also change the projected total sales in the KPI too!
Promotional Discount Simulation
For the second WriteBack I wanted a manager to be able to test out promotions on certain products to see what it would do to the sales. So the fields for this schema are Product Category, Promotion Start Hour, Promotion End Hour, Discount, and Projected Increase in Sales.
The idea is to trial a promotion on a certain category at specific times, and they can test out different discounts and estimate the uplift in sales from the discount.
So in the highlight table we can see that 10am-11am tends to be a peak time across most days. As a manager I might want to simulate a promotional discount of 10% during that peak time and I'm estimating that we might get a 20% increase in sales.
Adding this into the WriteBack will update our Sales by Category chart and we can see the new projected promotional sales for the Tea category. The change seems small but the projection will only increase or decrease the sales between the selected hours.
Other Use Cases
Those were the two examples I thought would fit the user story but the possibilities are endless. If you had staffing data, users could adjust staffing plans or they could plan inventory orders. You could also allow users to simulate promotions at a more granular level such as specific store locations or specific products.
Overall, WriteBackExtreme was a fun extension to play around with for the project. It's great being able to add or edit the data without having to leave Tableau but what's even better is the ability to see the changes in the visuals to be able to see potential outcomes at just a glance.