


So the last blog (linked) covered sets and parameters with lots of examples on the different ways you can use them.
Today's blog is basically Parameters Part 2! It will go over Dynamic Zone Visibility (DZV) in Tableau and will also compare it to Bookmarks in Power BI.
DZV in Tableau
DZV helps us show or hide certain views using parameters and parameter actions.
1 - Let's start by setting up a chart selector
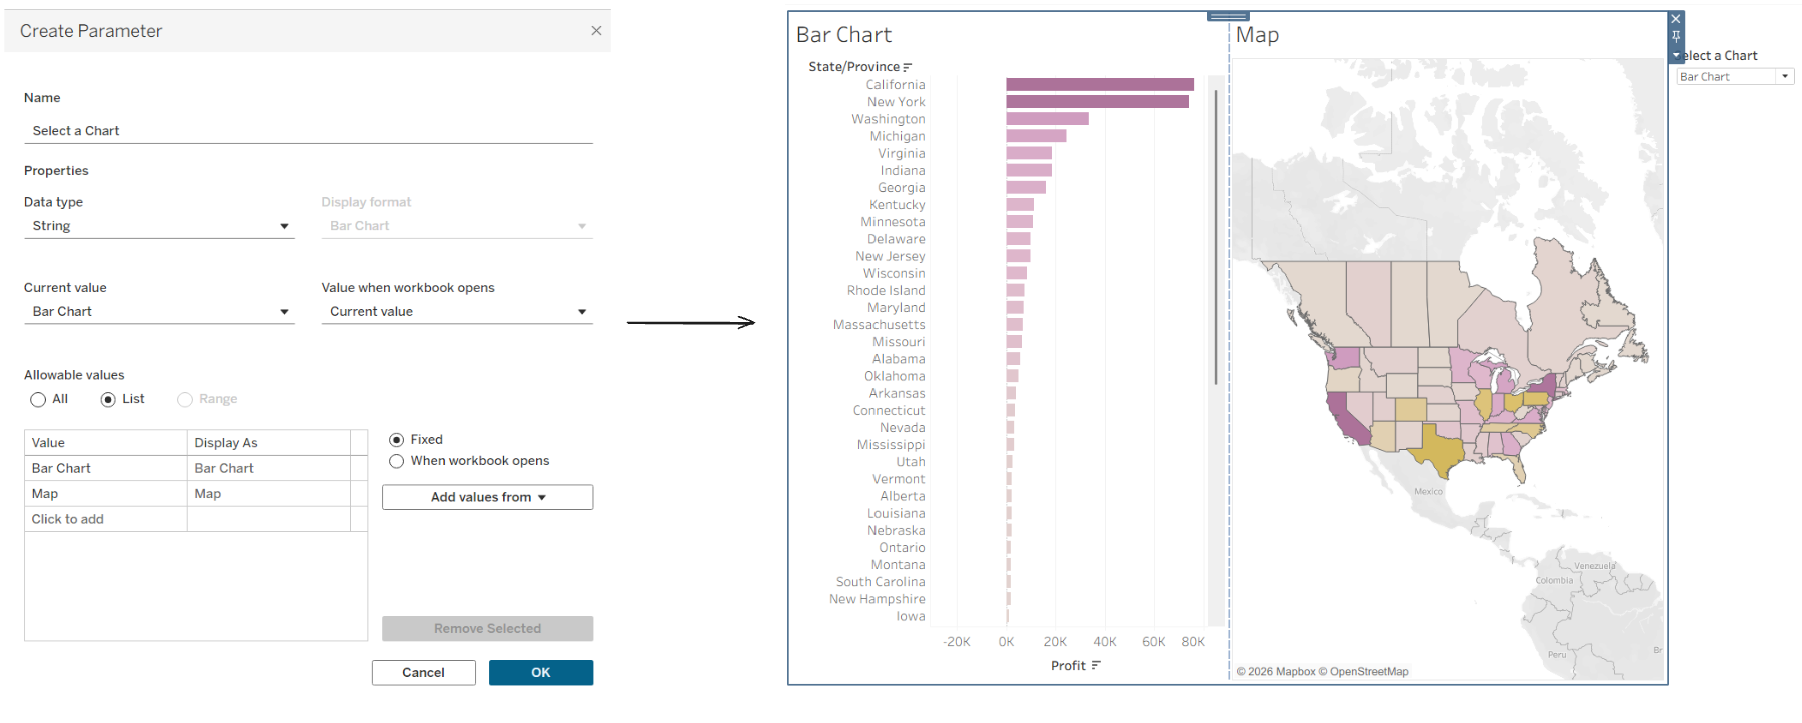
So just like in the other blog, the first thing we should do is create a parameter. The charts in my example are going to be a bar chart and a map so the data type will be a string, and I've added those to options as a list. Make sure you "Show Parameter" so that this selector is available.
Next we want to go to our dashboard and add a container for our charts to go into (the container is important don't skip this).
2 - Create calculated fields
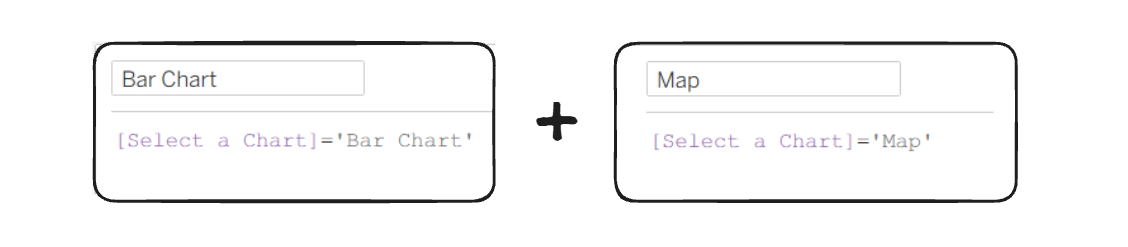
These calculated fields just need to use the options from the chart selector parameter so that we can link the charts to the parameter on the dashboard.
3 - Using the calculated fields on the dashboard
On the dashboard we can go to the layout pane and choose "Control visibility using value" and then add them to the relevant charts. So choose the bar chart, and under the control visibility using value option, you select the "Bar Chart" calculation, and vice versa for the map. You can watch the effect below :)
Bookmarks in Power BI
In Power BI we can also change the view and control what charts we see using bookmarks.
1 - Prep stage
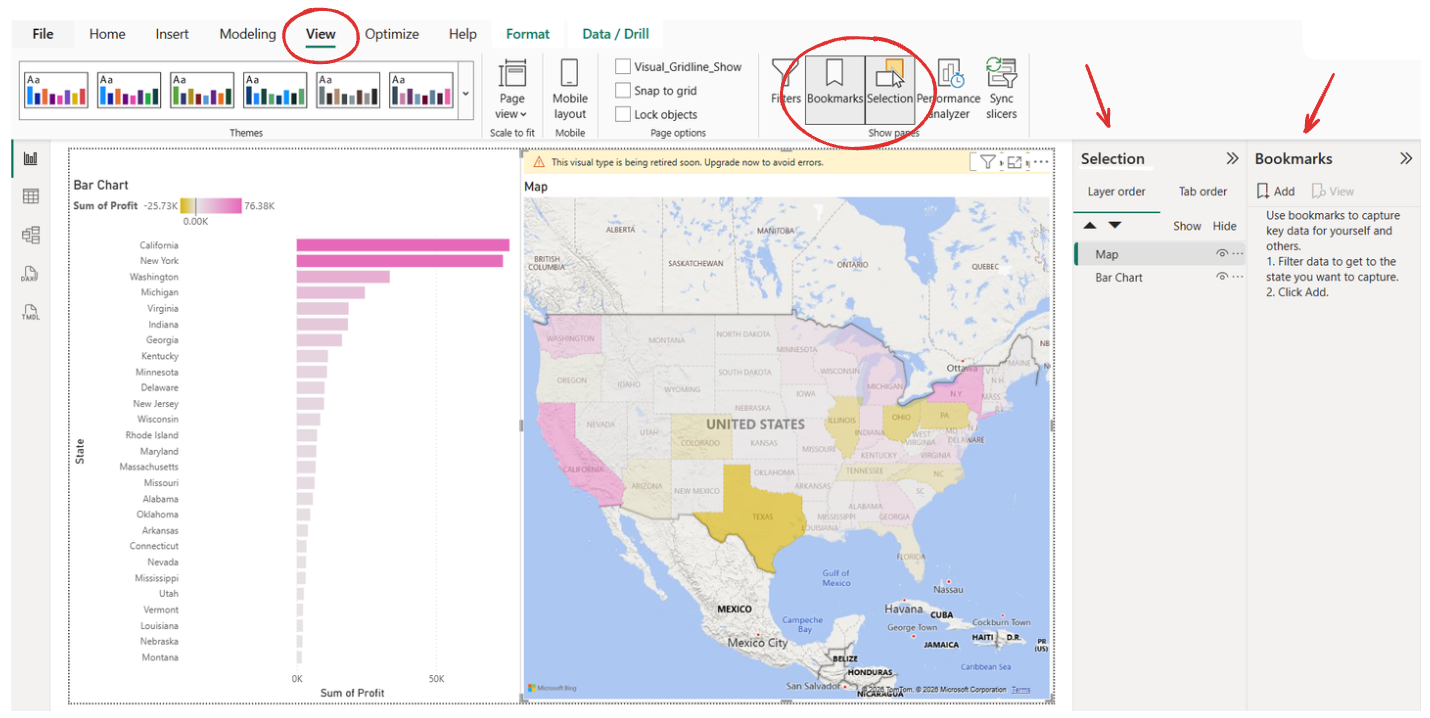
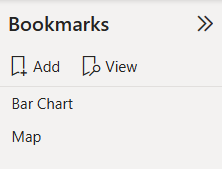
The first step would be to go to "View" and check that both the "Bookmarks" and "Selection" pane are selected.
2 - Create your Bookmarks
Press "Add" to create a new bookmark. Create 2 bookmarks, one for the bar chart and one for the map.
3 - Set each Bookmark to view the relevant chart
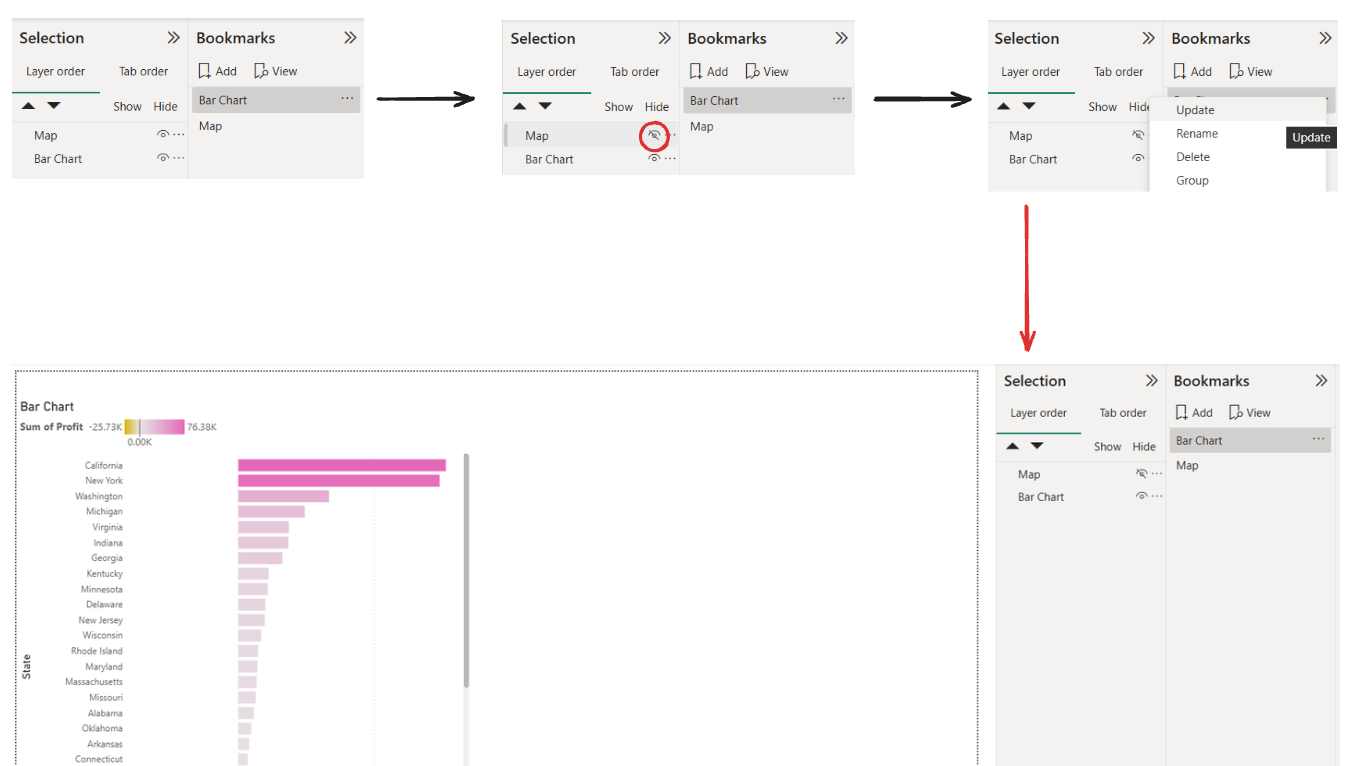
So for the "Bar Chart" bookmark, you will want to hide the Map under the selection pane and then click on the three dots (or right click) and update that bookmark.
Then do the same for the "Map" bookmark. Hide the Bar Chart in the selection pane and then update the bookmark.
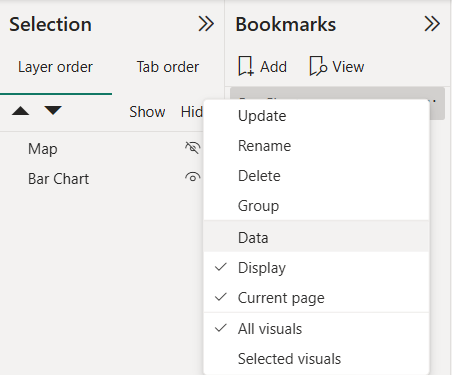
Deselect "Data" and make sure "Display" and "Current Page" are still selected. This is because if "Data" is selected, the bookmark will save any slicers or filters you've currently selected and so later if the user interacts with the page, and then switches to another bookmark, their selections will be undone.
4 - Add Bookmark Buttons
Next go to "Insert" and under "Buttons" hover over "Navigator" and choose "Bookmark Navigator". Then two buttons are created that can be used to change between the bookmarks and therefore switch between the views.
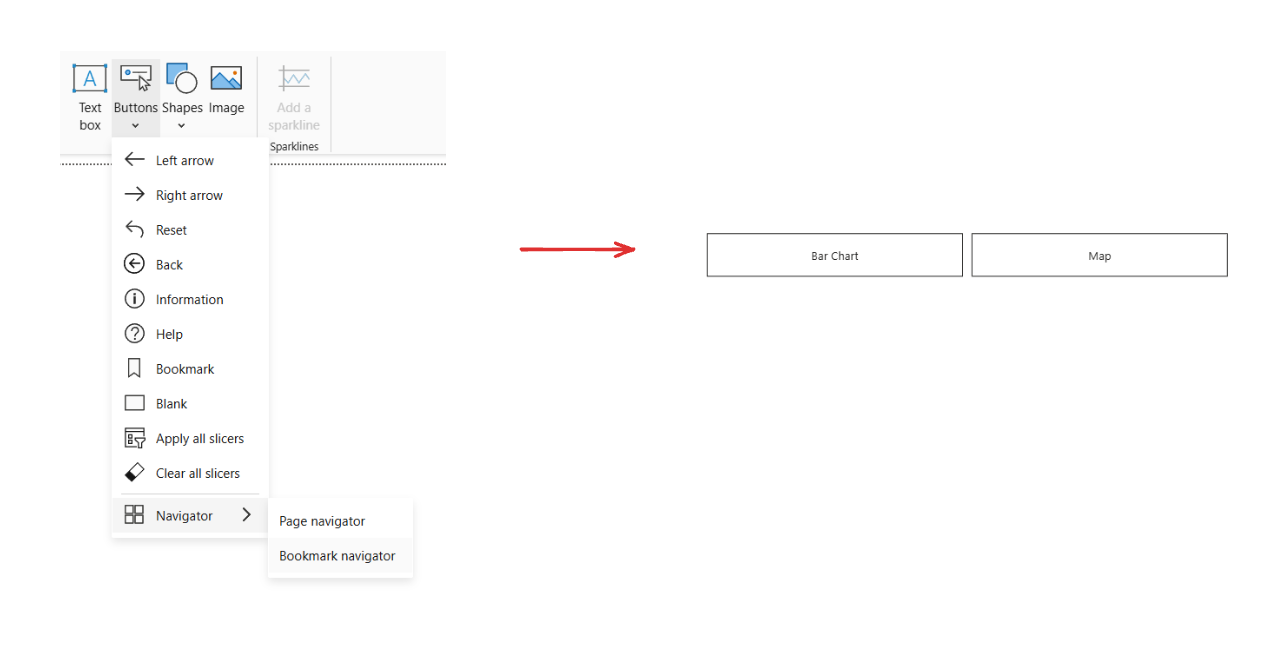
Which will look like this for the user!
So in Tableau, Dynamic Zone Visibility uses a parameter to show or hide visuals on the dashboard. In Power BI, bookmarks control which visuals are visible by saving and switching between display states using buttons.