Welcome back to the penultimate installment of our dashboard week. Today held a great task for us, which was to pull in data from a Breaking Bad API and make a Breaking Bad Dashboard. I am a huge fan of Breaking Bad and have watched it two times over.
The API was created by Tim Biles, a developer out of Dallas, Texas. The data revolves mainly around Breaking Bad but also Better Call Saul. The rate limit is 10,000 requests per day and no authentication is needed. There were 4 tables from what I saw, which were Characters, Deaths, Quotes and Episodes.
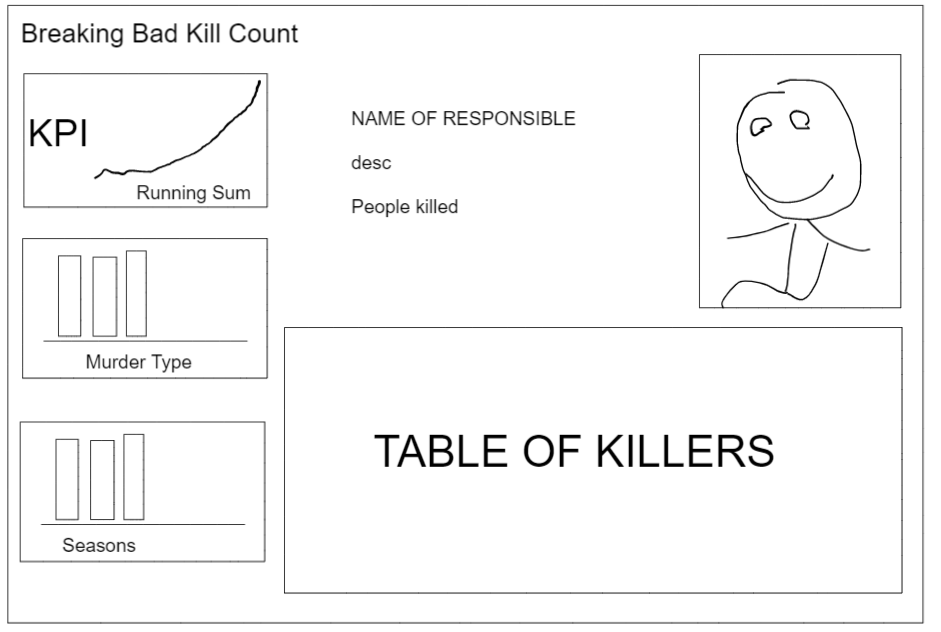
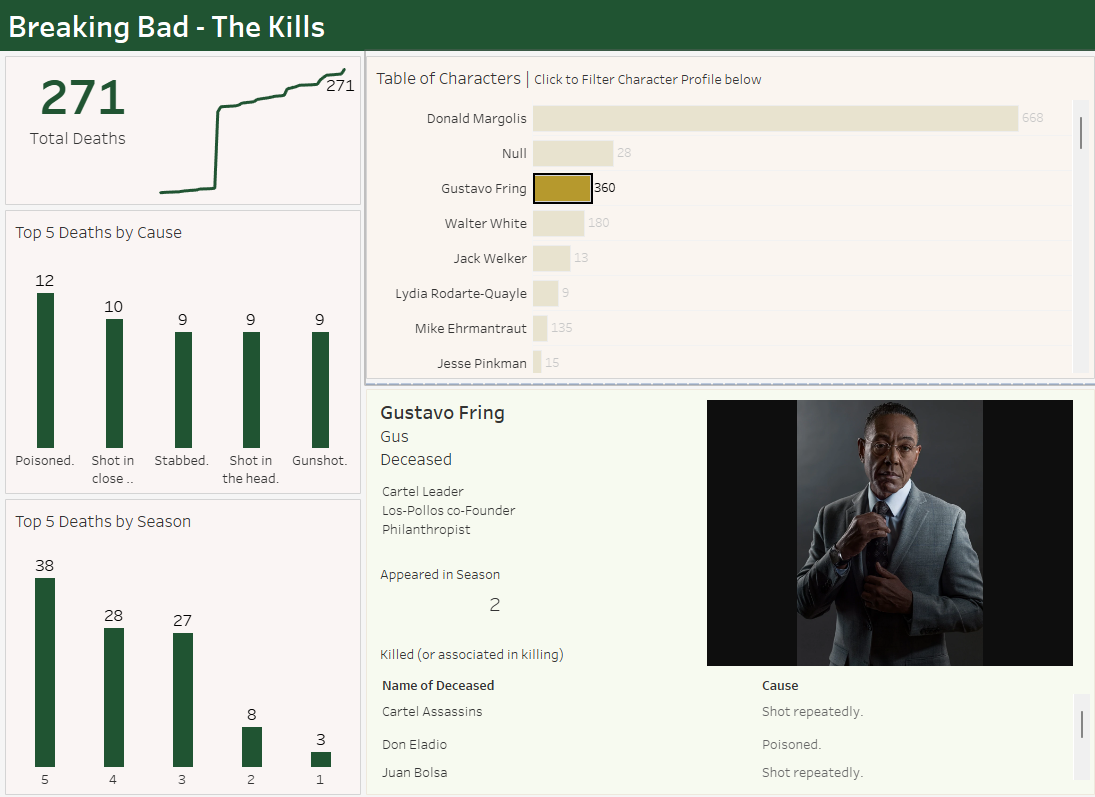
I chose to use characters and deaths to make a killer dashboard (no pun intended), which shows deaths by some dimensions and also an interactive character profile section.
This was the dashboard plan:

To pull the data from an API all that was needed was the URL https://www.breakingbadapi.com/api/ which was then followed by the table of data I wanted (characters or deaths).
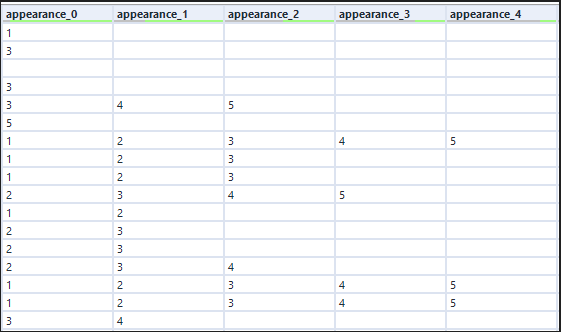
For the characters table, there were arrays for 3 fields. The appearances field, Better Call Saul appearances fields and the occupation field which looked like so:

To solve this I made a workflow that transposed them and then filtered out the blank values. However, I had to do appearances and better call Saul appearances separately otherwise the filter tool would drop off rows that I needed since some characters only appear in one show.

The deaths data was much simpler to pull out.
Once I started building my dashboard things became much harder. I had to join the two tables to combine the kill data with the character data but this proved much more difficult since some of the "Responsible killers" had more than one name in them. For example it could be Mike (ordered by Gustavo Fring). Therefore, I had to do a find & replace tool to replace any part of the field with the name from the other table. However, since Mike and Gustavo are both names in the other table, only one would appear even though they both really killed the victim!
In the end I was able to make a working dashboard, it isn't the best I've ever done but it was a move away from traditional analytics.

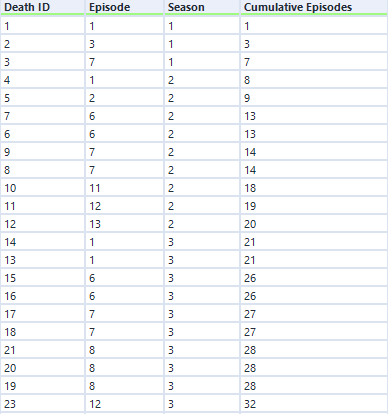
My personal favourite part was the running sums of deaths only because of how the fact that it wouldn't be possible with normally formatted episodes. I had to make a cumulative episode field which would basically make a running sum. Here's how:

Firstly, I sorted the data in ascending seasons and episodes to assure they were in chronological order.

I then made a multi-row formula with this formula. What it is saying is:
- IF the current Season is equal to the row before, then add the difference between the current episode and the episode before to the new Cumulative Episodes field. IF the current season is not equal to the one before then just add that episode to the episode number before.
Here is the outcome:

