Today’s dataset was the same dataset given to our Coach Valerija’s final interview when she applied for the Data School Program. It includes data of Iowa Liquor Sales and actually seems to resemble the superstore dataset very much. In this dataset, Iowa is the superstore and an actual store are the customers purchasing liquor from Iowa. Each row was actually an item part of a larger order ID. Hence, the invoice/order ID was unique to a single item from a larger order.
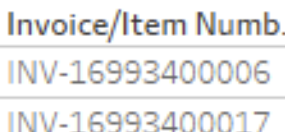
After some exploration, I noticed that the invoice/item number was a combination of the actual order number and the particular item. To create these fields, I took the left 10 characters to make the order ID and the right 5 characters to make the item number.
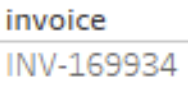
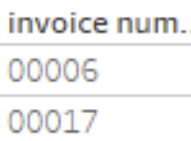
This new field allows me to know the total number of orders placed at a certain time and not just a particular item.
To further prepare the data, I had to make the longitude and latitude in the proper spatial format along with the other fields that had come in string formats when an integer or float type was needed.
After the data prep, my mindset was back on business revenue overview where it was all sales, profit and quantity. Hence, I wanted to make a dashboard similar to what I have done previously comparing previous month to current month.

Below is a quick draft.
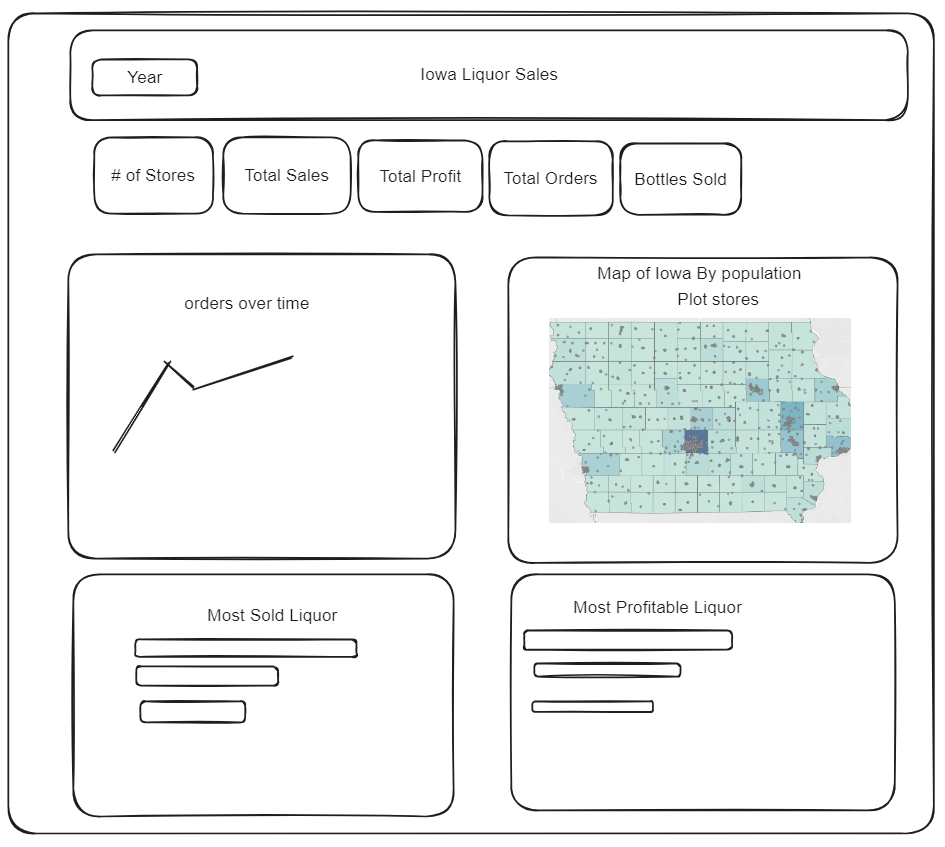
You can view my final dashboard here.