Today’s data was about squirrel sightings. This was actually a version of data similar to the final dashboard application for DSNY2. However, DSNY2 has a larger dataset where sightings were reported for several days in Central Park. The squirrel data today was only data collected from March 1, 2020 in 20 parks in NYC excluding Central Park. There were 433 sightings with data on the park as well as the squirrel’s appearance and behavior.
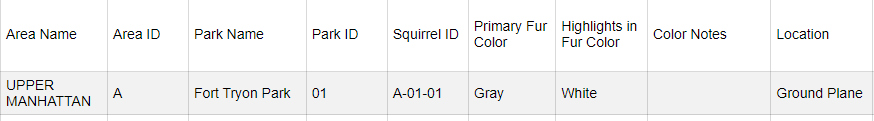
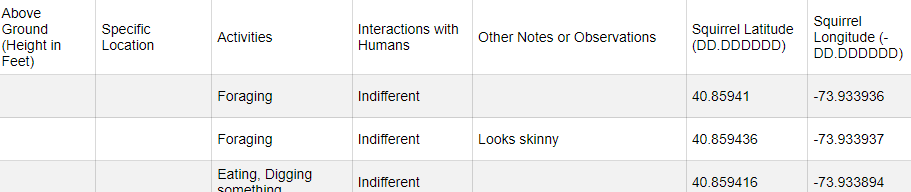
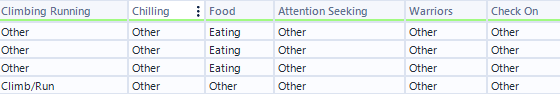
I was interested in the behavior of the squirrels, specifically the activities field. However, the activities field was made of several terms separated by commas. In addition, some of the terms are similar to one another but are not exactly the same. To prepare this field, I made six new columns with a binary value each representing whether a specific key term was mentioned or not.
I then made my draft of what my dashboard would look like:
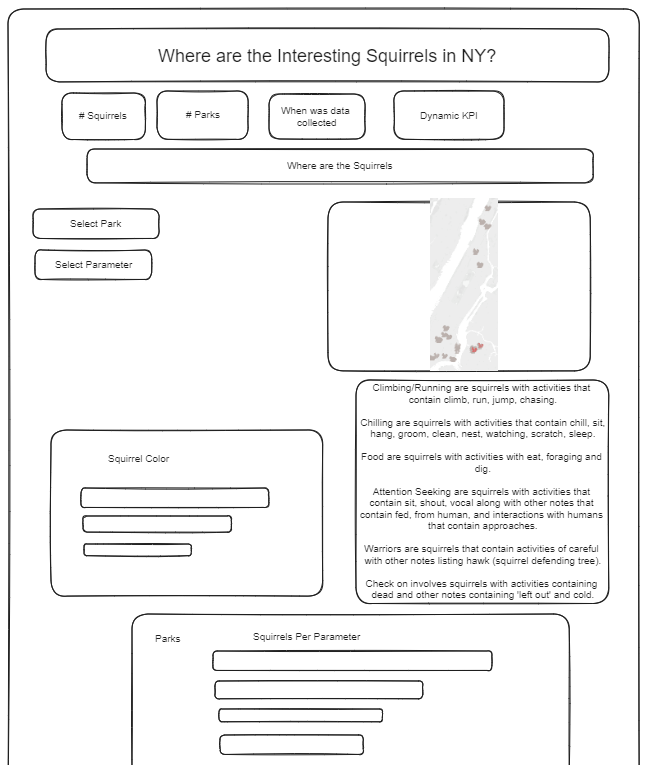
My final dashboard followed quite similarly to my draft but had a different format in chart placements.
Photo by Shane Young on Unsplash