Client
PitchSide Pro, a global e-commerce retailer specialising in football merchandise
Some of the products they specialise in include:
- Club kits and national team gear
- Boots and training equipment
- Scarves, collectibles and fan culture
PitchSide Pro has grown over the past 5 years through:
- Seasonal demand
- Major football moments
- Product launches
- Digital channel expansion
Brief
The Executive Leadership Team at PitchSide Pro would like to make sense of the peaks, patterns, and stories clearly and answer the following questions:
- What is driving changes in revenue performance over time?
- Where should the business focus next to sustain growth?
The primary users of the dashboard will be the Executive Leadership Team, who will:
- Check the report daily
- Start with top-line performance
- Expect precision
- Want to drill into the numbers when something looks off
The dashboard needs to be clear at first glance and deep and trustworthy on interaction.
The client wants:
- A clear explanation of what’s happening over time
- Identification of real drivers of performance
- Insight across:
- Products
- Regions
- Channels
- Customer segments
- Strong defensible recommendations
Data
- FactSales
- FactTraffic
- Date
- Product
- Customer
- Region
- Channel
- Data Dictionary
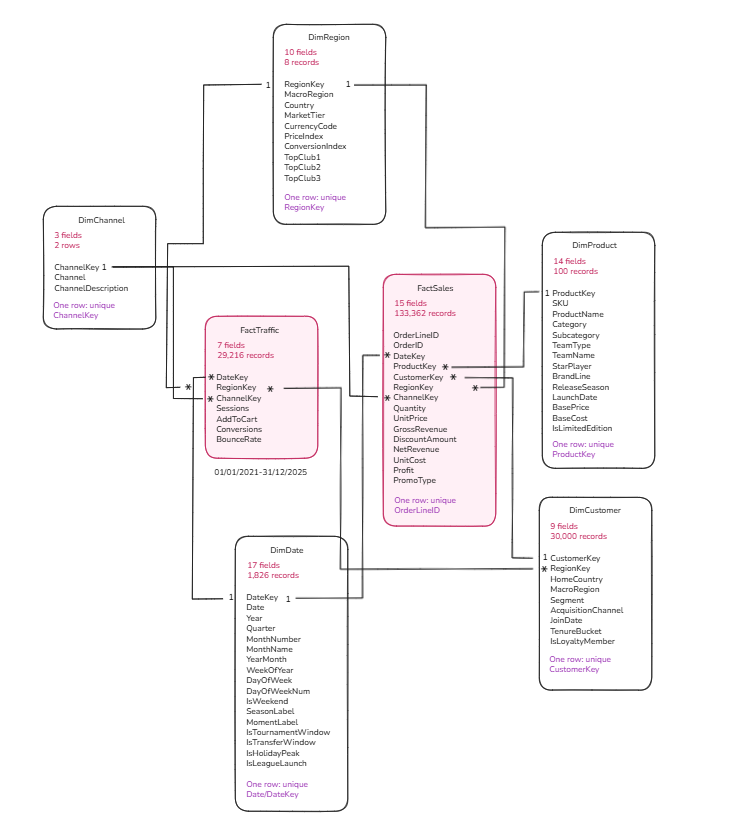
Data Model Sketch
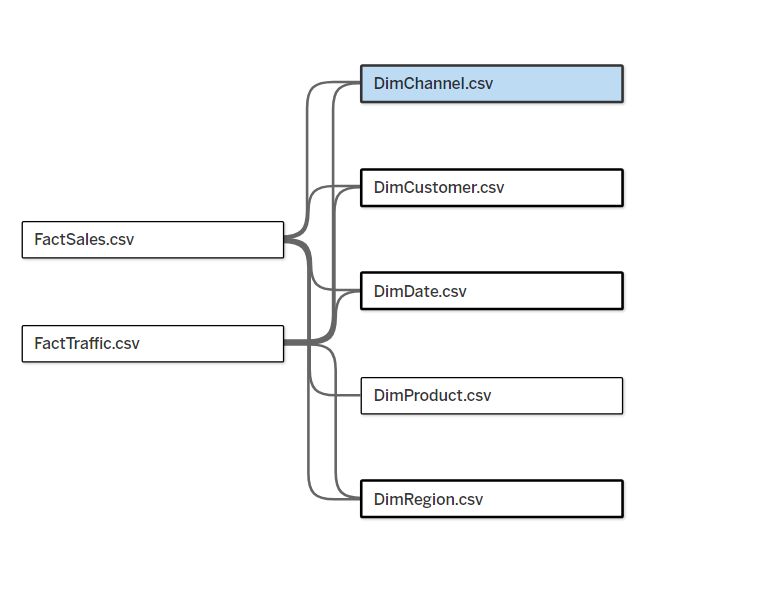
Data Model in Tableau Desktop
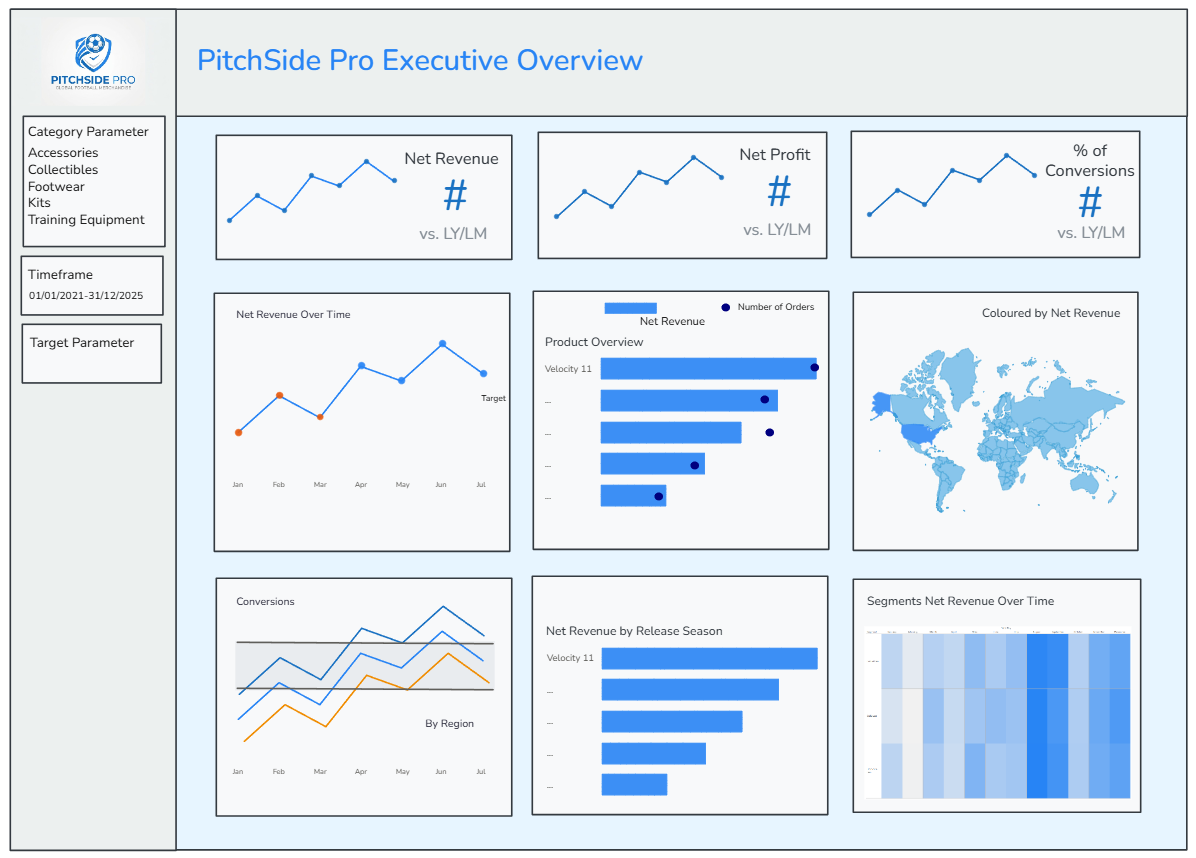
Sketch
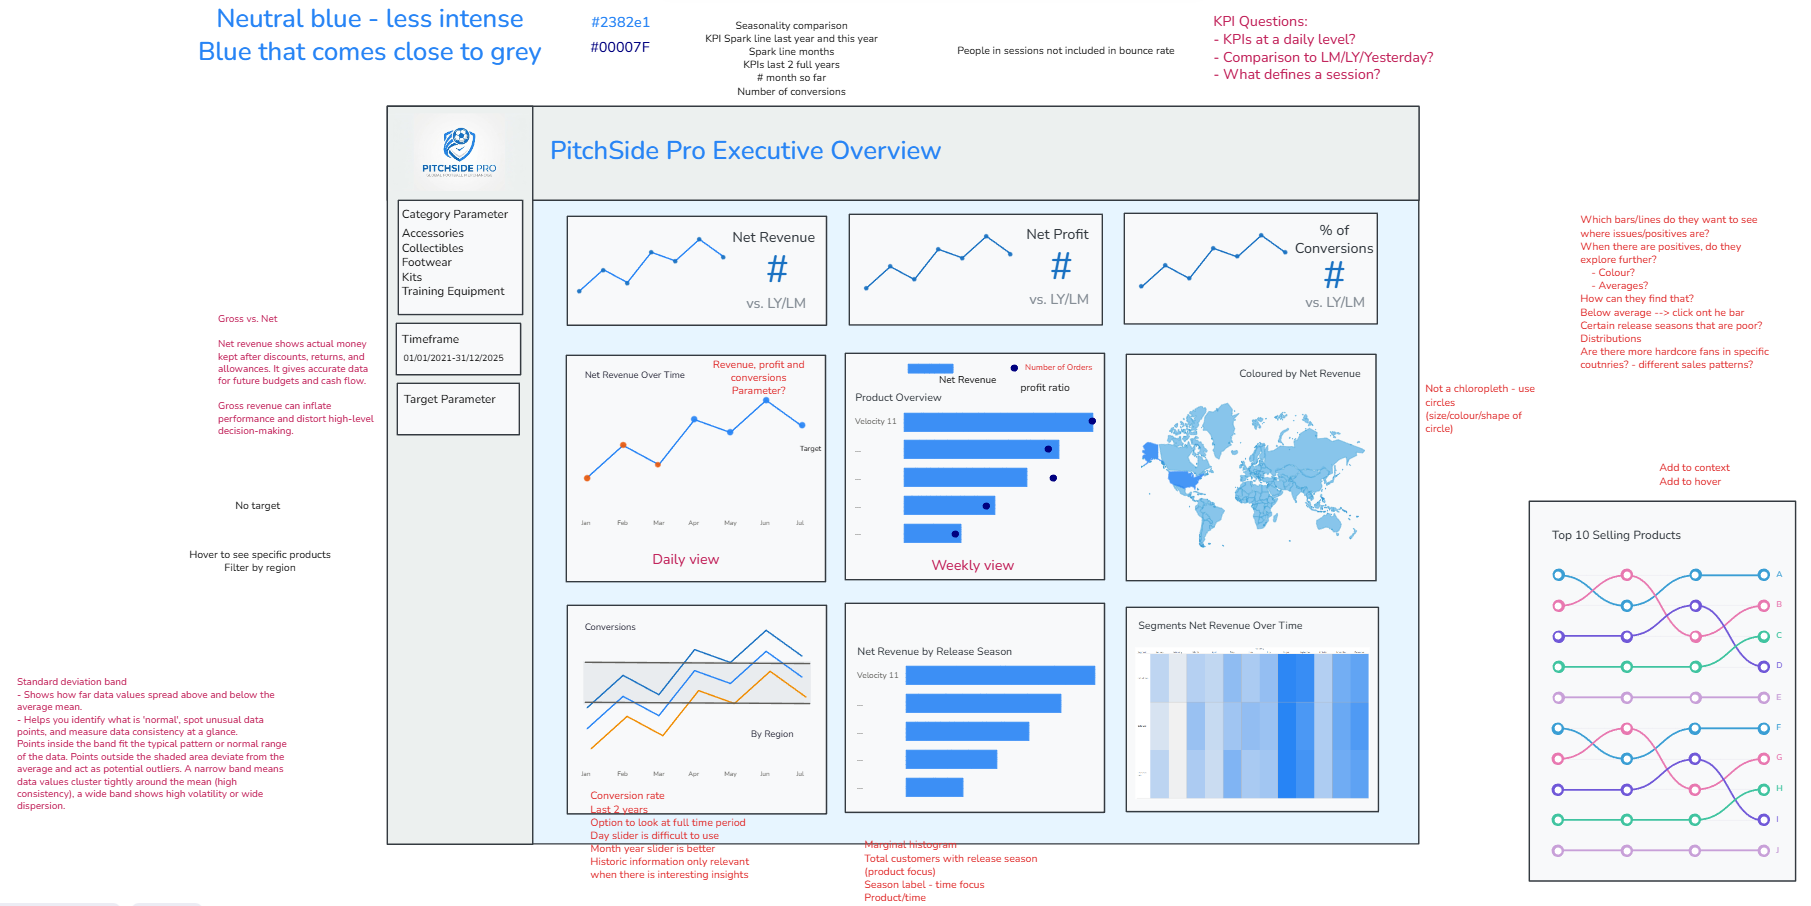
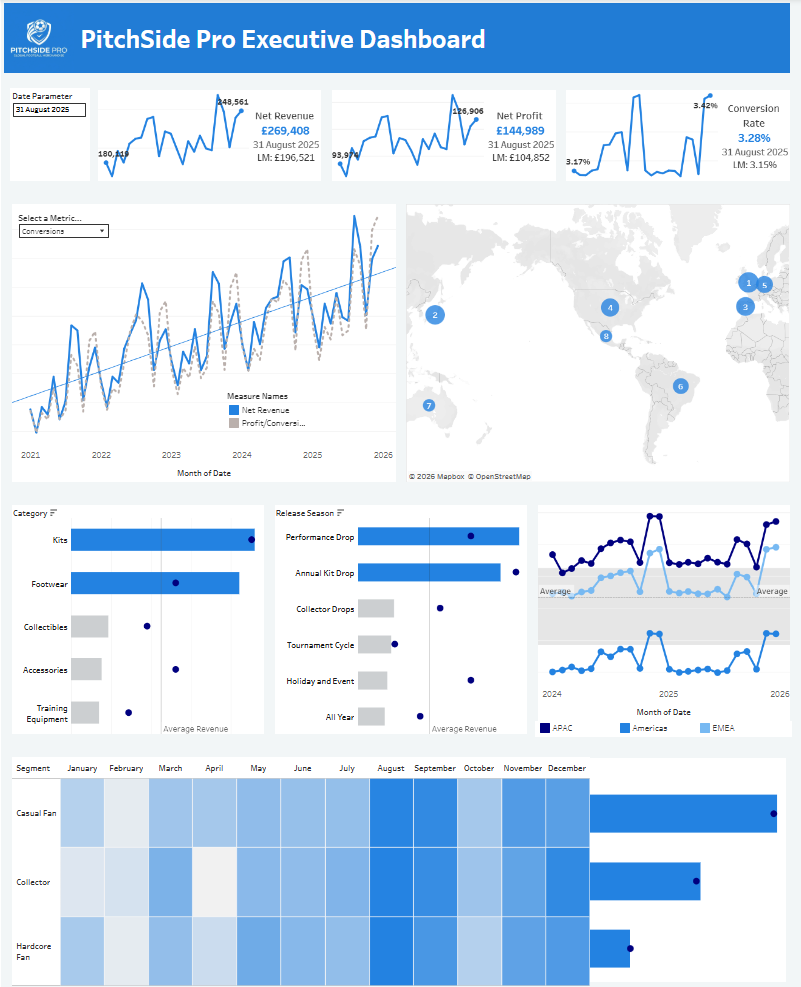
Dashboard