


For Day 3 of Dashboard Week, DS58 were tasked with looking at Anime data!
Brief
Build an infographic on a series/genre/users or a story you can find in the data using Power BI.
Data
Cleaned data files:
- Anime_cleaned.csv
- Animelists_cleaned.csv
- Users_cleaned.csv
The data includes information about:
- Over 5,000 unique Animes
- 100,000 users
- 8,000,000 lists with ratings
User Story
As an Indie Anime Streamer, I want to identify anime movies with high rating scores but low popularity counts across different genres and sources, so that I can add them to my watchlist!
For this particular user story, I decided to only look at the 'anime_cleaned.csv' data set as it included all relevant information. The data included 33 fields and 6668 records with one row being a single anime id. Each record included information about the source, date released, rating, popularity and several other metrics. I wanted to focus solely on movies, so filtered to only include the 907 movies in the data.
Sketch
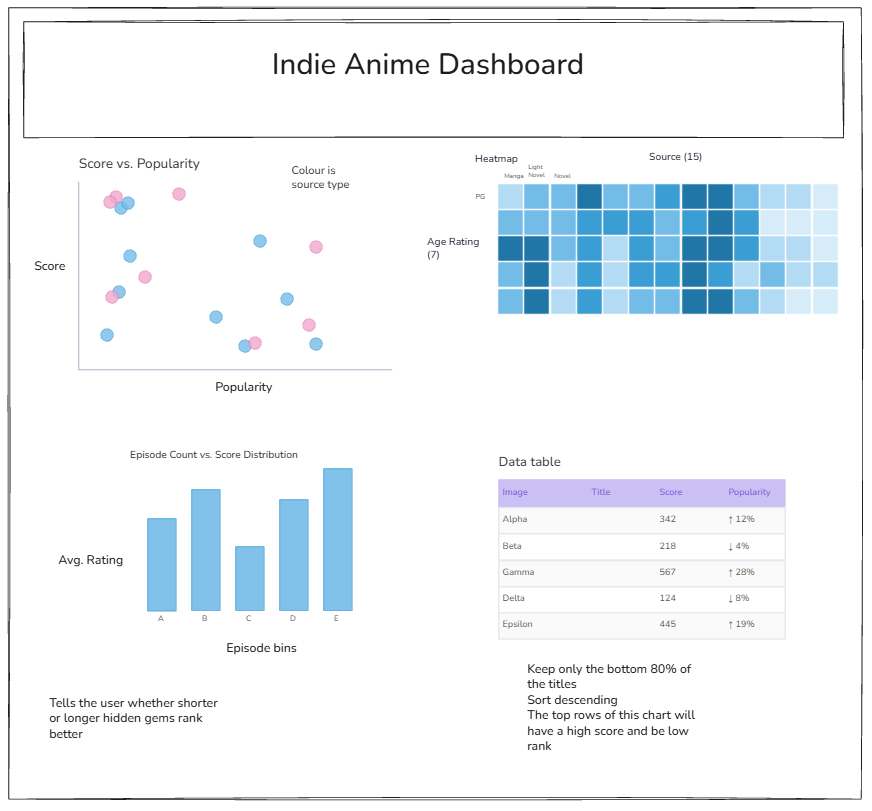
Dashboard
That's all for Day 3. I am excited to see what tomorrow holds!