


As part of dashboard week, our task for today was to pull data from one of NASA's many APIs, then visualise this data in any tool we wished.
NASA has some really cool data, and I chose to pull images of the Earth from space, along with their metadata (coordinates, date taken, and so on). This involved two stages - the first stage obtaining the metadata, and the second the images.
The API only allows 1 day of data to be pulled at a time. I created an Alteryx flow pulling the metadata for 1 day, then pivoted the data so that each row of data corresponded to 1 photograph.
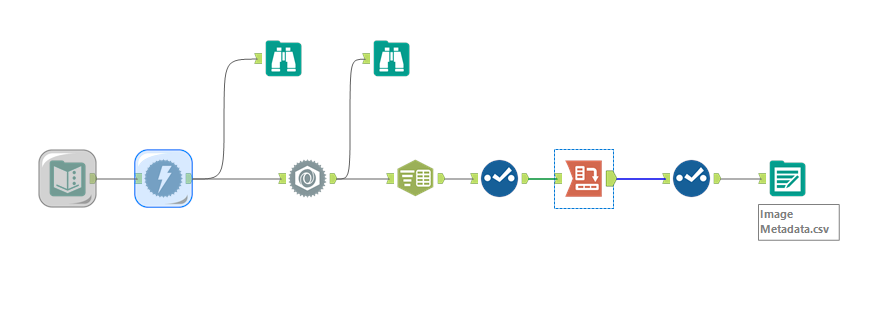
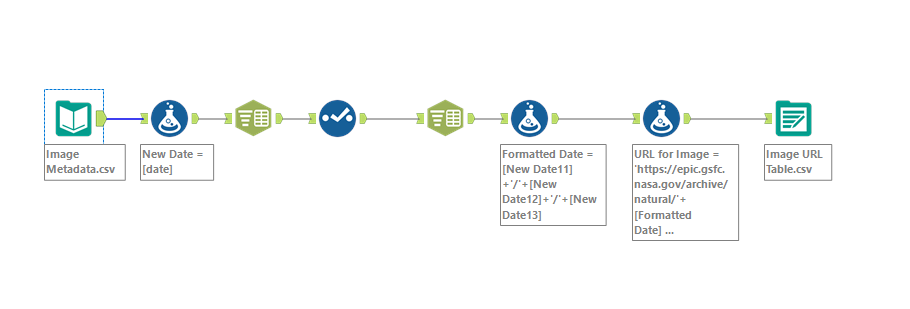
Next, I found the format of the URL required to find the images themselves online. I then used the data from the API I had accessed already along with some formula tools to create a new column of the image URL addresses.
Once I had this URL, I created another flow to pull the images from the web. I configured the Download tool to output the data as a blob. I then used the Blob output tool to output the images as pngs, appending the ID field to the file name so that the images would be identifiable once saved.

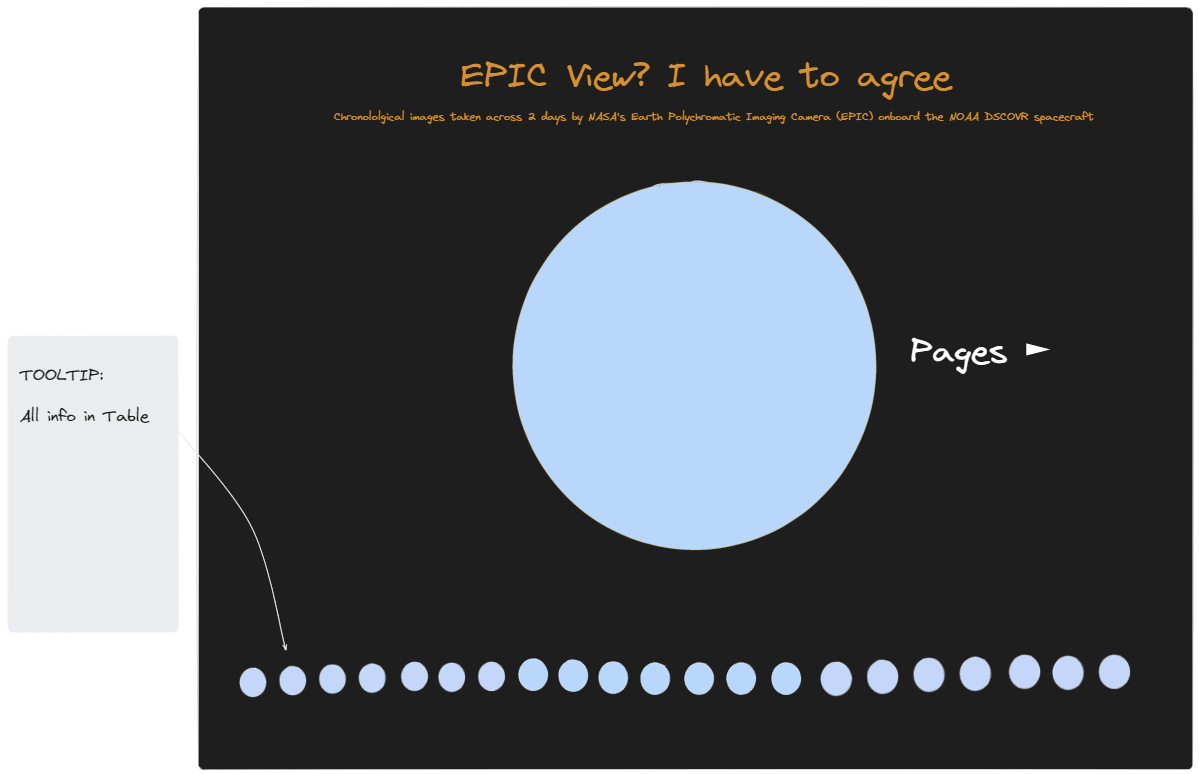
Now I had all the data I wanted, I sketched my visualisation:
The most difficult part was assigning the images to their corresponding rows of data - watch out for a future blog on this! Then it was finally time to visualise - here is what I came up with:
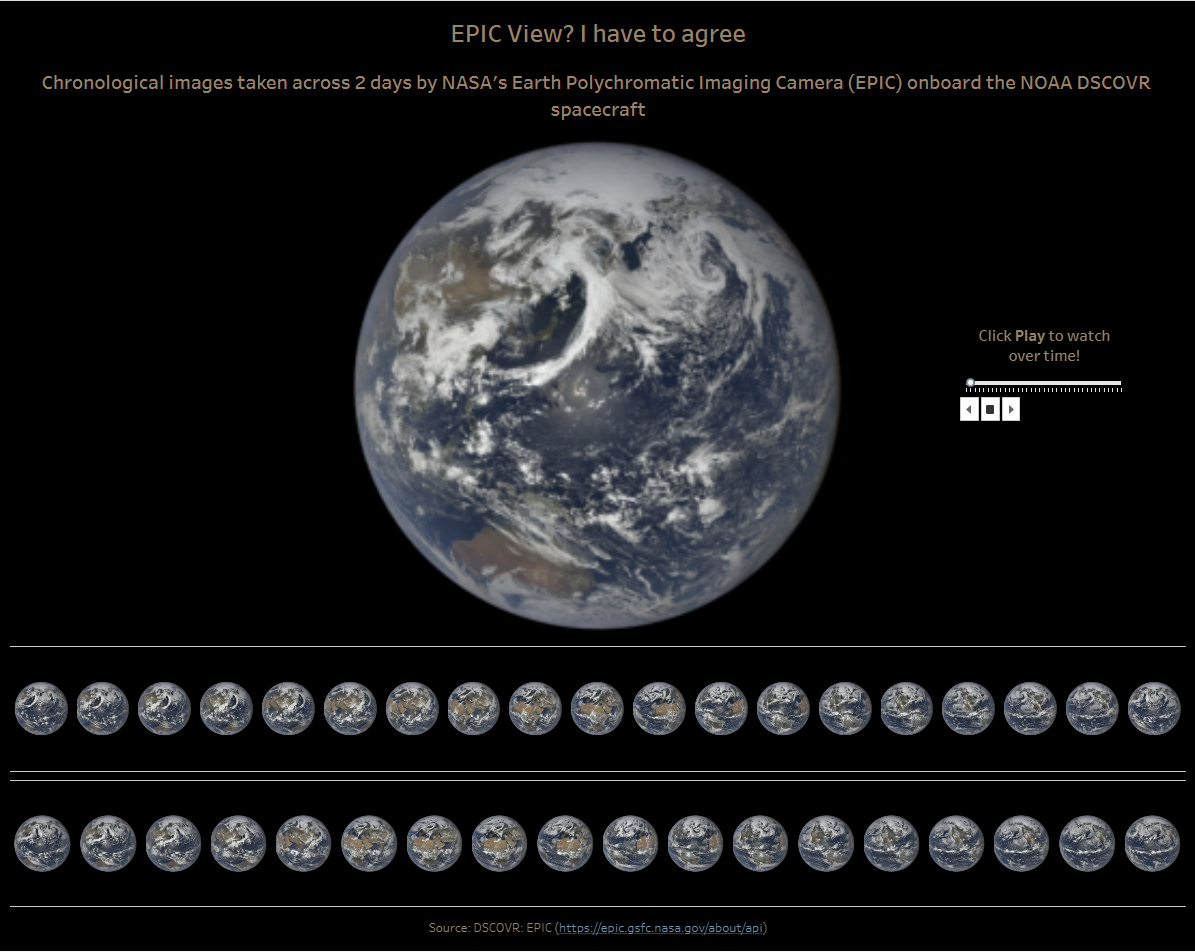
https://public.tableau.com/app/profile/zoe.reed2956/viz/NASAWorkbook/Dashboard1
Thanks NASA 🚀