


What is a moving average?
A moving average gives us a frequently updated average over time. This is useful to get an overview of what is happening on average in a set of data as time progresses, smoothing out extreme peaks and troughs.
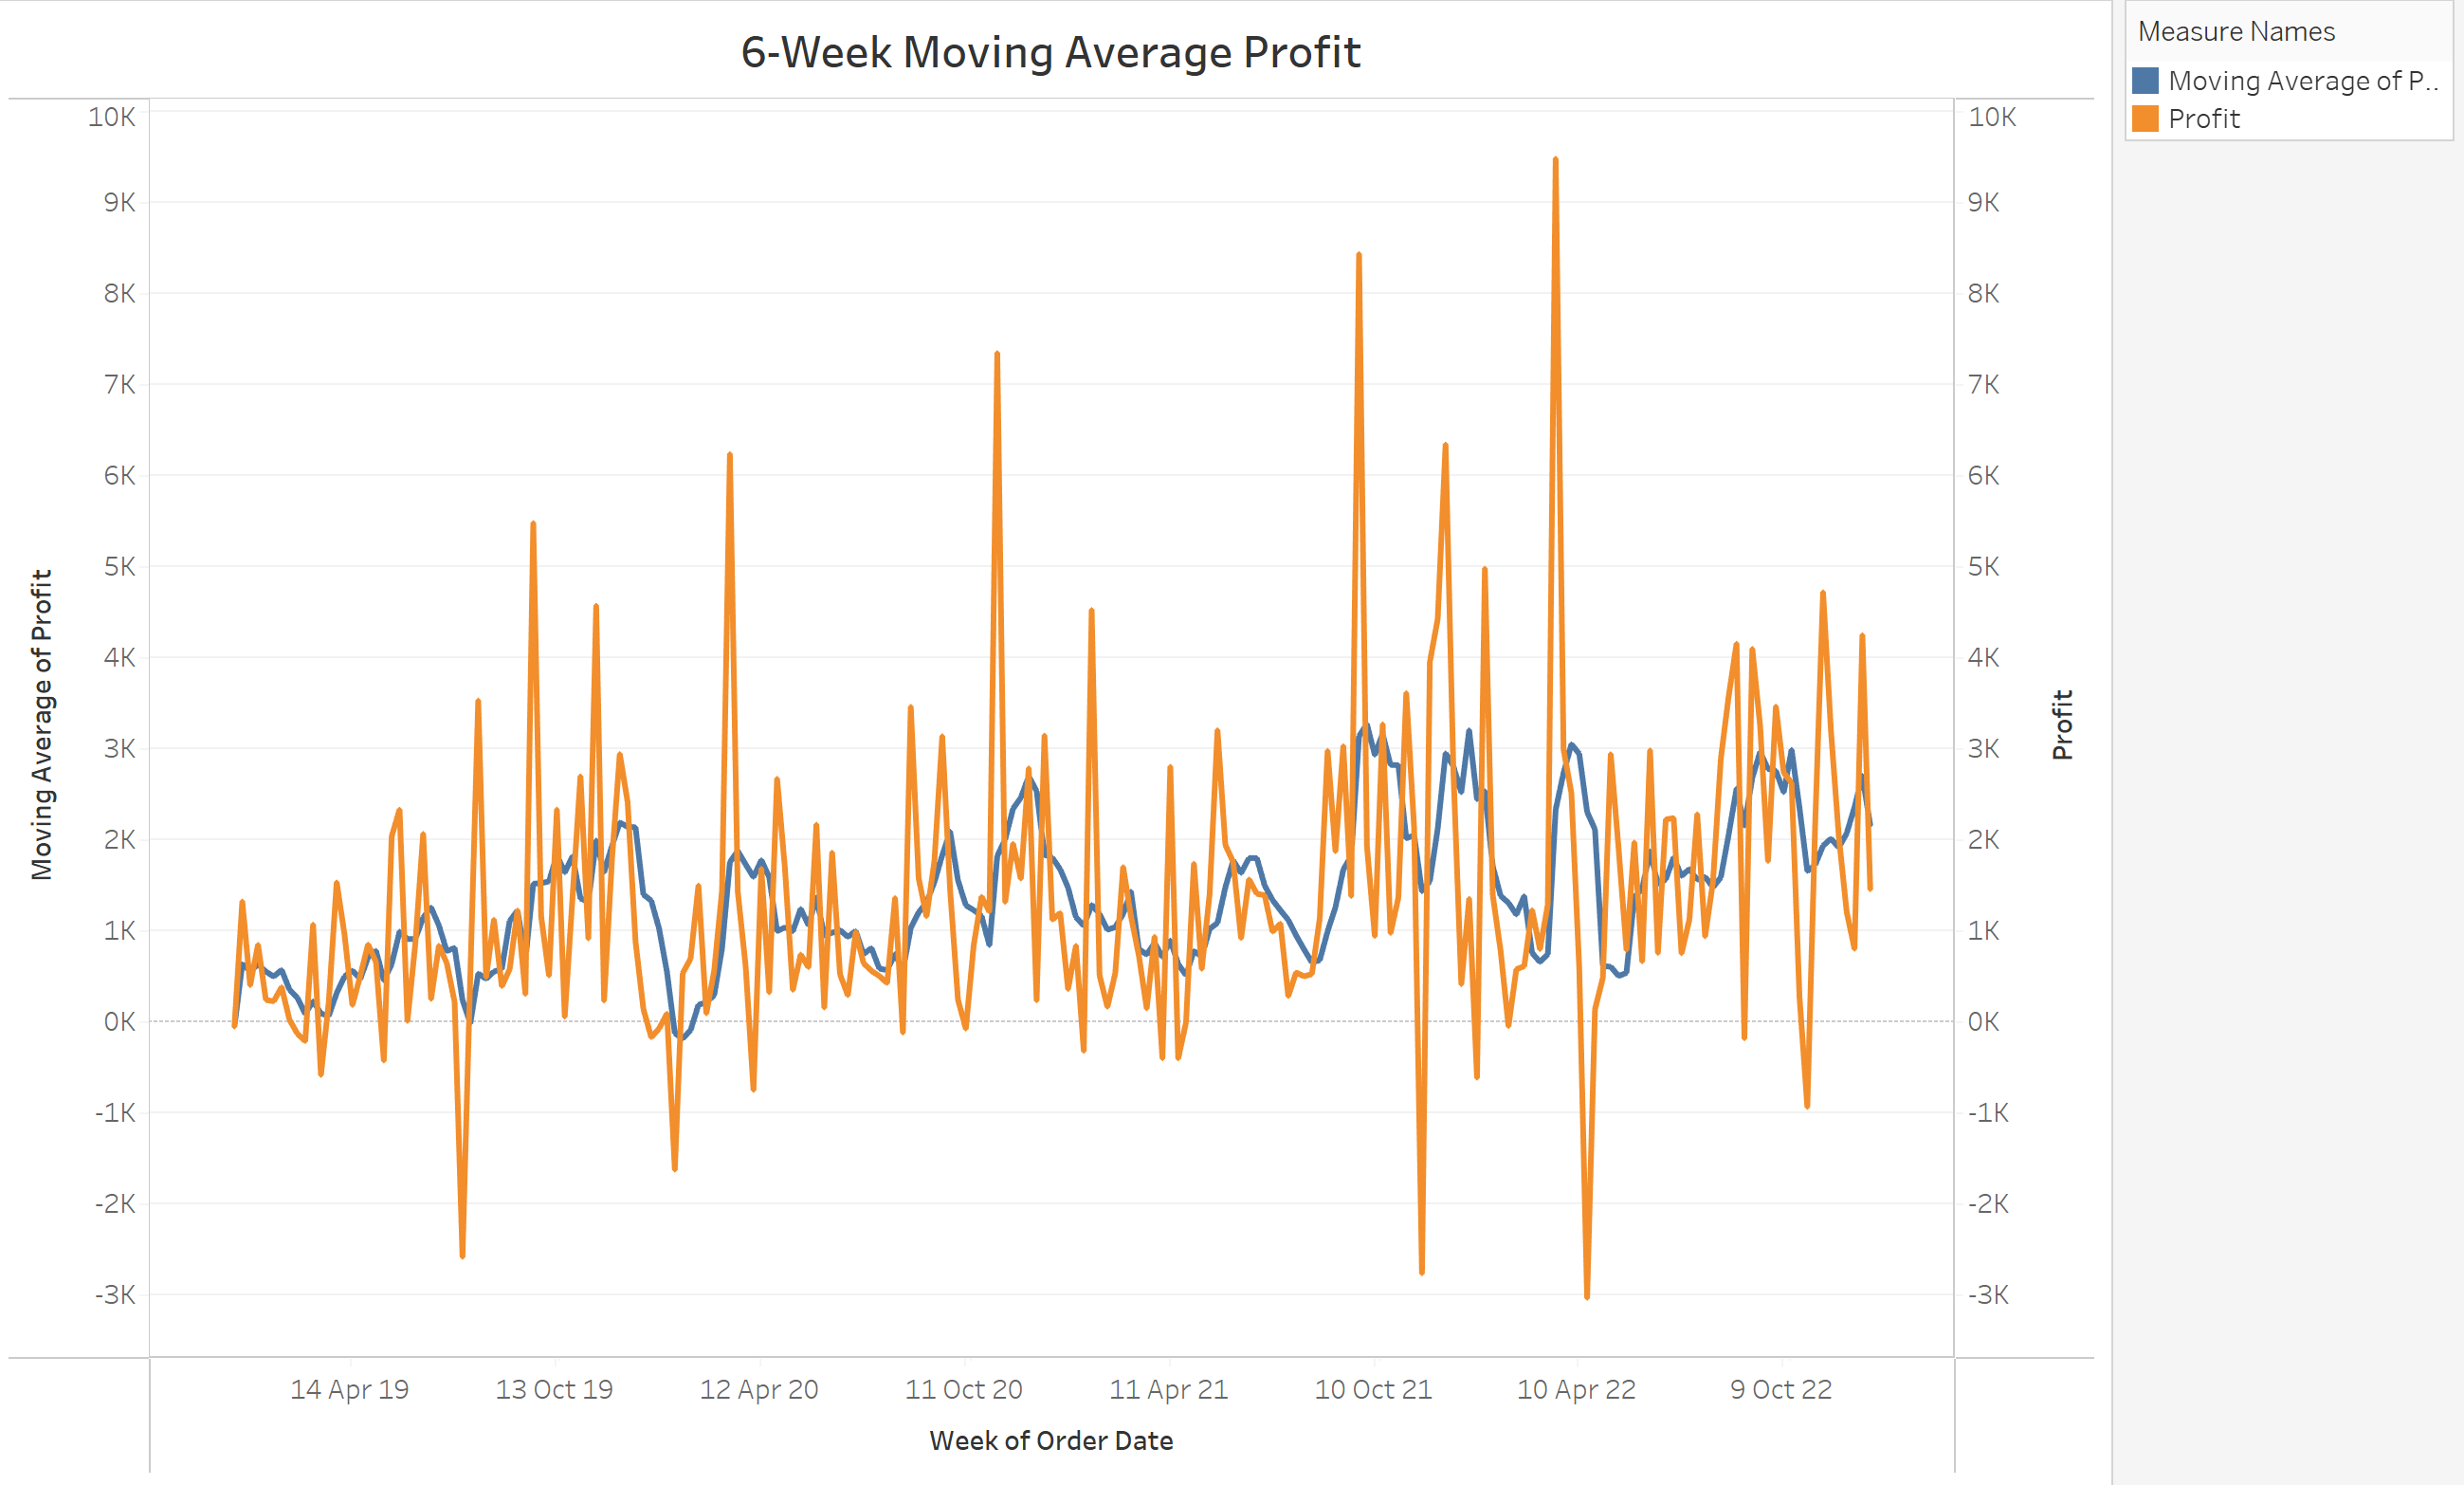
We will create a moving average of profit over time - below shows profit over time alongside a moving average of profit over a 6-week period:
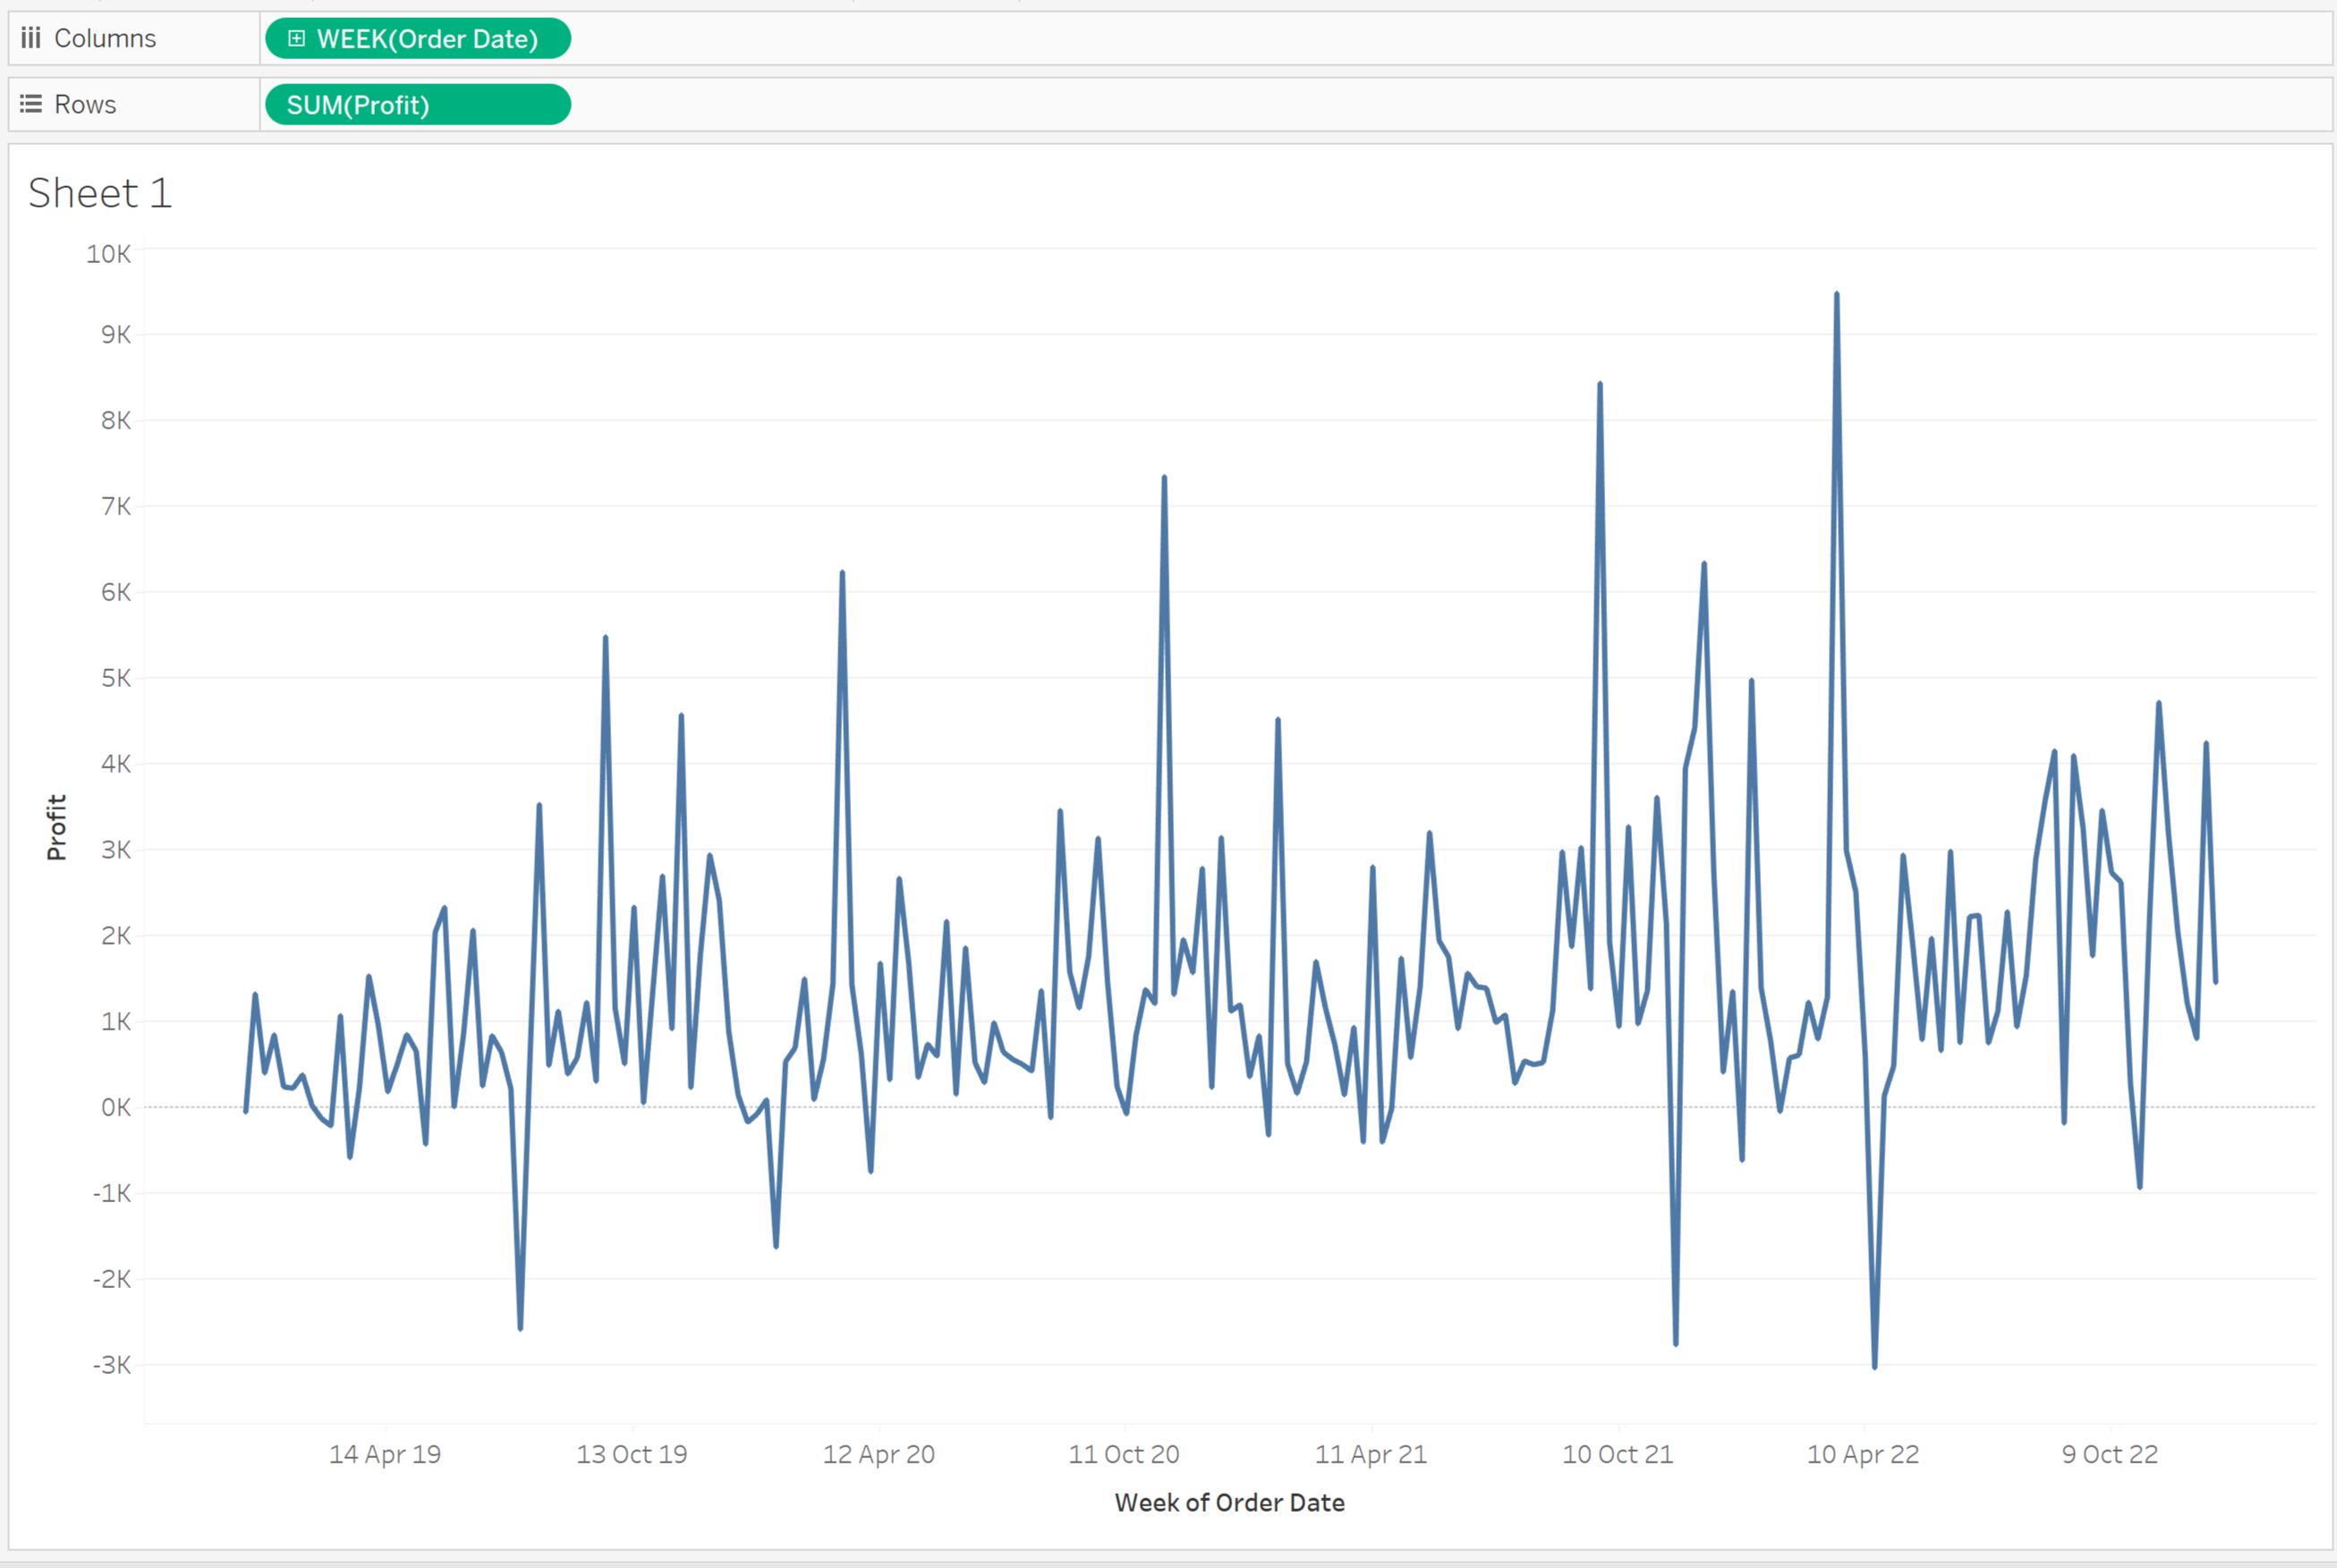
1) Drag your date into columns and profit into rows to get a basic line graph of profit over time:
2) Click the dropdown on SUM(Profit) in rows and select Add Table Calculation.
3) Configure as shown:
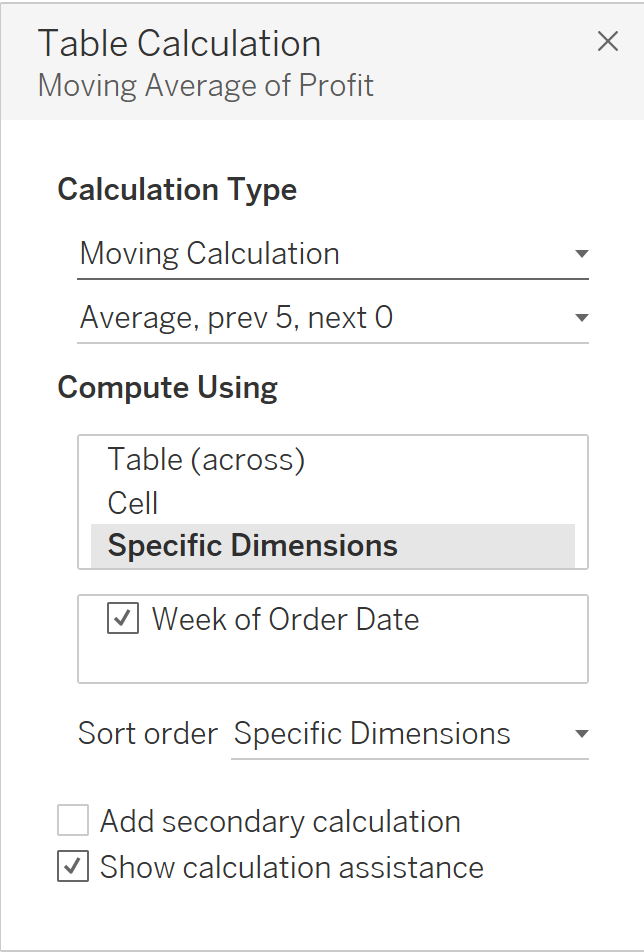
The Previous Values and Next Values determine the period over which the average is computed. Previous 10 Values will use the previous 10 data points in the calculation - so here last 10 values would mean the last 10 weeks as our date is in weeks.
NOTE - If Current Value is ticked then the current data point is included in the calculation. As we want a 6 week moving average, we will choose 5 previous values.
Select Specific Dimensions. In the box below, for the things that are unticked, the calculation will restart at every "one of these". Here, we need to keep Week of Order Date ticked as the calculation requires access to previous data points. Unticking Week of Order Date would isolate each data point and therefore mean that the 6-week moving average could not be computed.
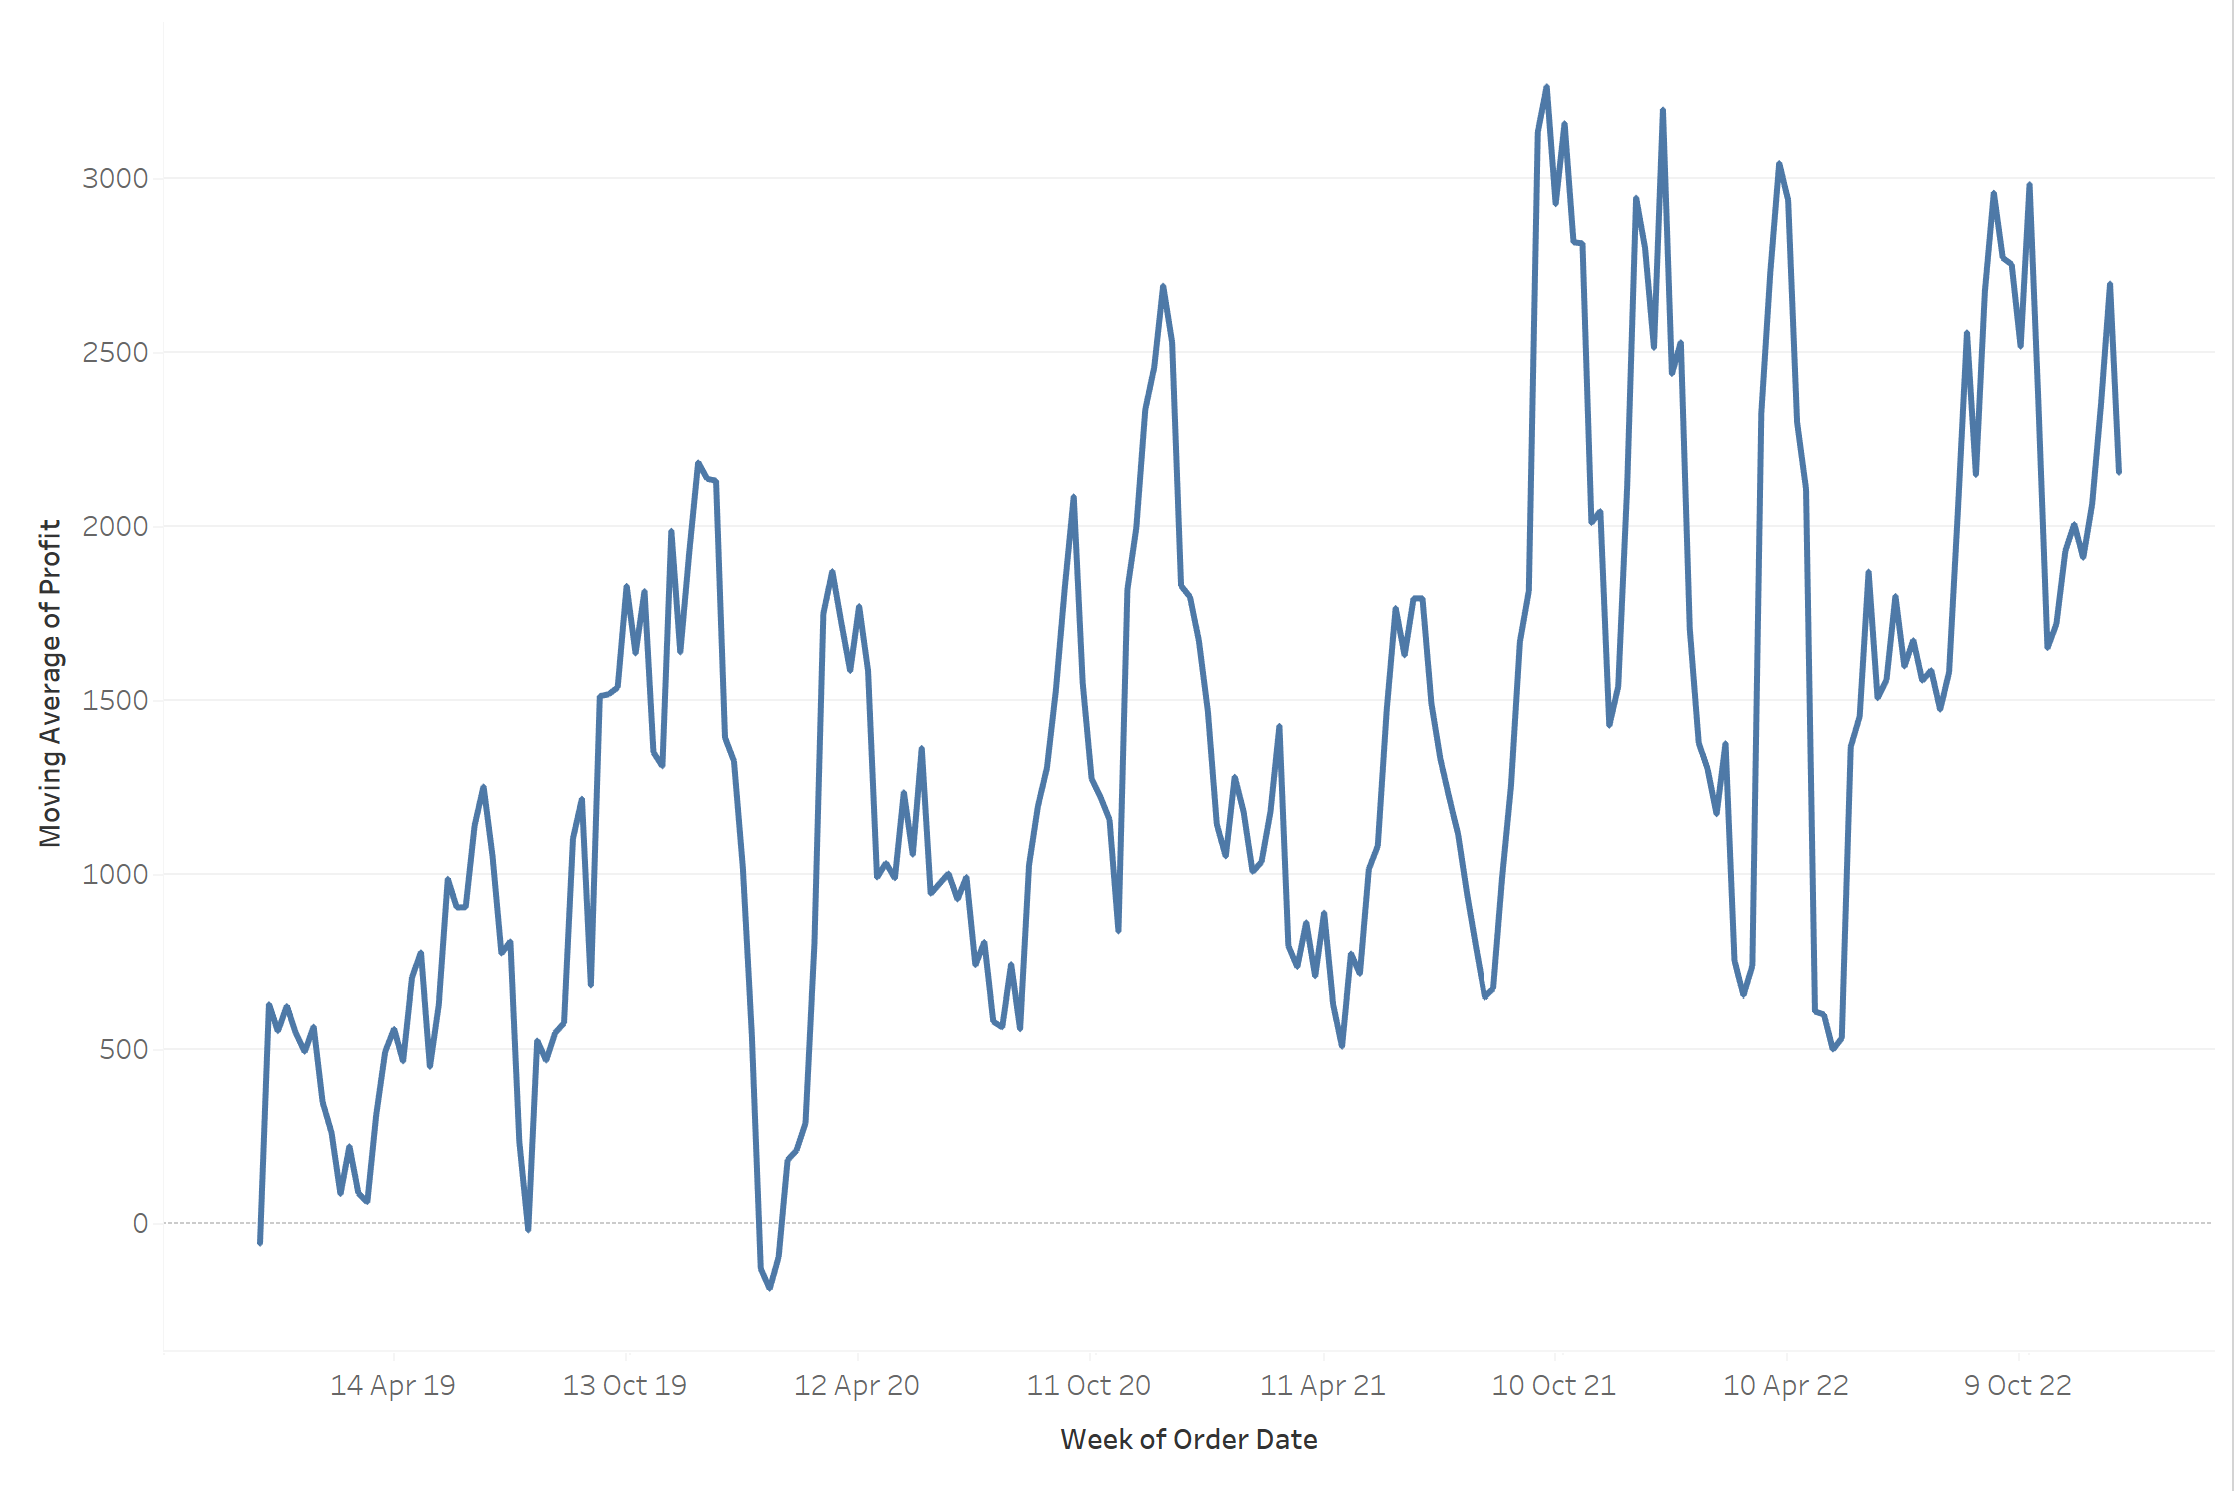
We now have a moving average line:
Then, to show our moving average alongside the profit, drag SUM(Profit) into rows. In the SUM(Profit) dropdown in the row click dual axis. Synchronise the axis' by right-clicking on the Moving Average of Profit axis and clicking synchronise axis.