Normalising data is a way of structuring datasets that reduces redundancy (duplication of the same information across multiple rows). This is done by storing data in multiple tables and creating relationships between them, often with the purpose of reducing the amount of storage required.
Denormalised data comes in the form of a singular table, and can contain redundancy in one or more fields. Denormalised tables often contain data from multiple tables that has been joined together, with the table structure designed to facilitate quick and easy read operations.
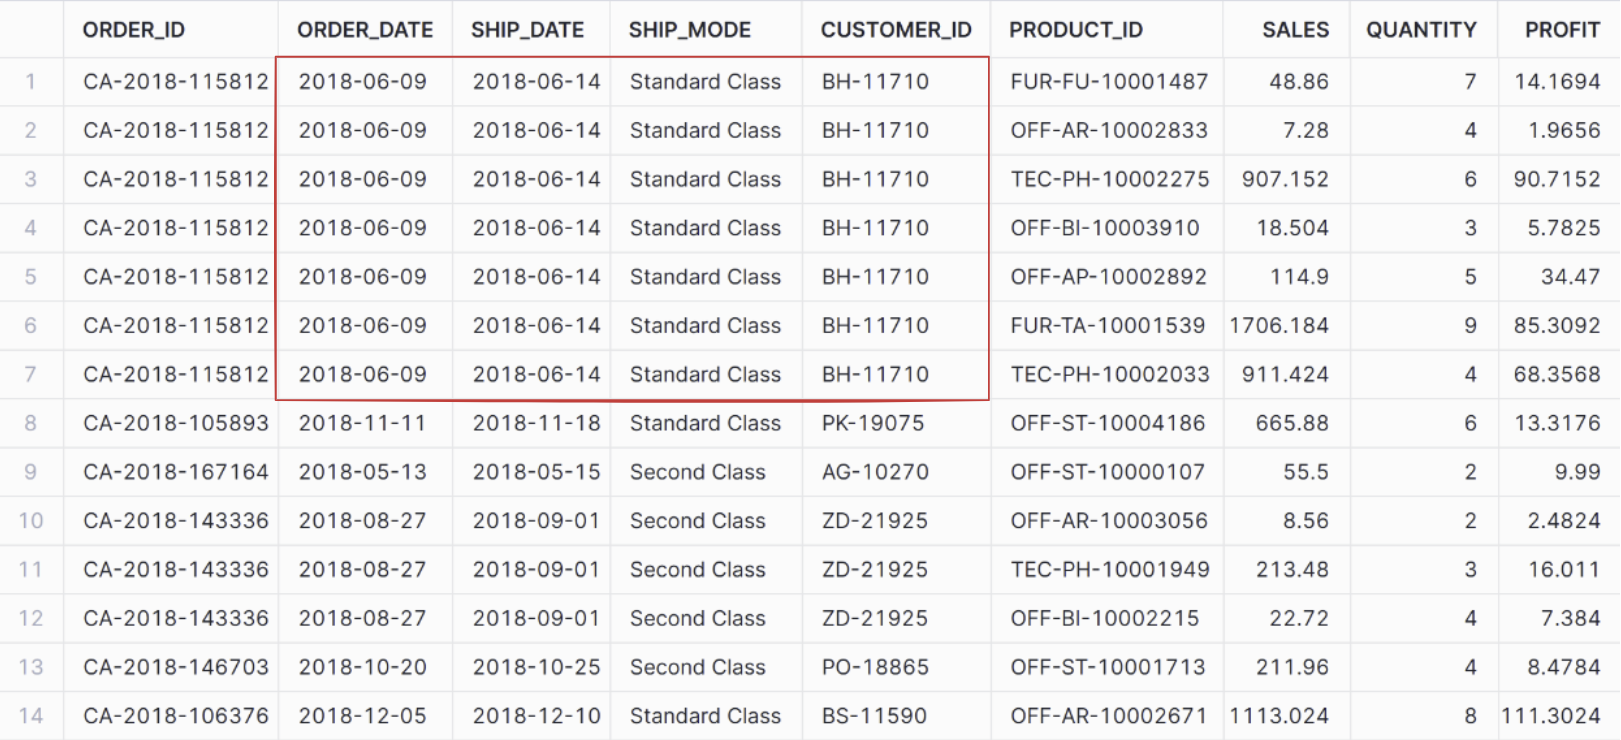
For example, below is a denormalised table containing order details. This table contains all the information available about each order, so that joins to other tables are not required and simple, low compute queries can be written to retrieve the required data. The granularity of the table is one row per item in an order:

Outlined in red, we can see that for each ORDER_ID, there is redundant data in the ORDER_DATE, SHIP_DATE, SHIP_MODE and CUSTOMER_ID fields as these metrics are consistent across each order.
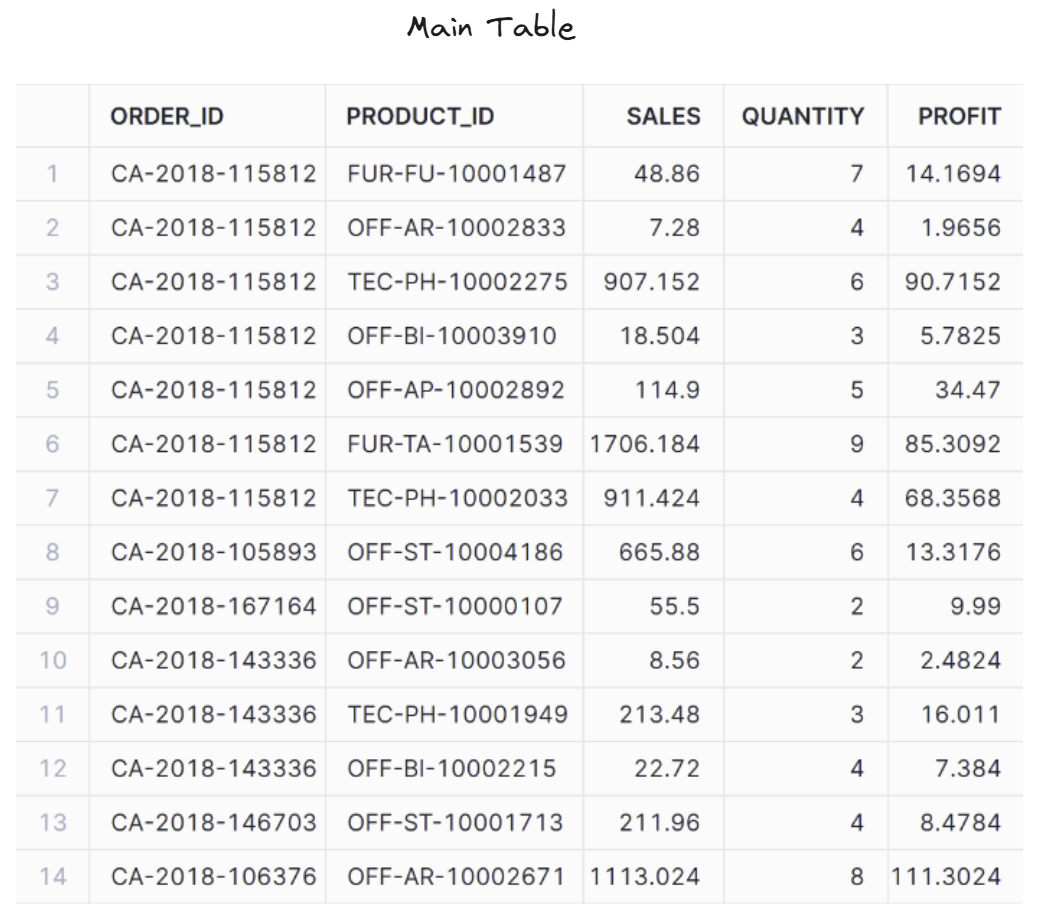
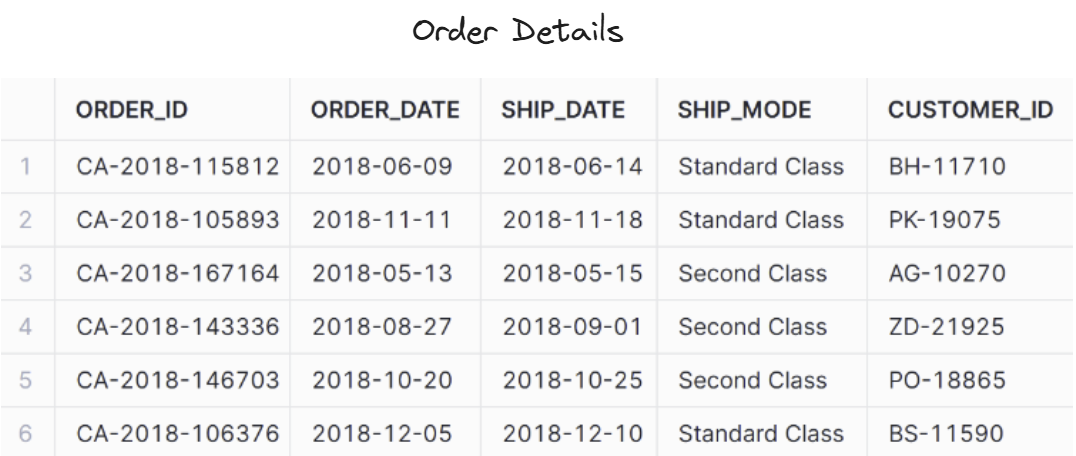
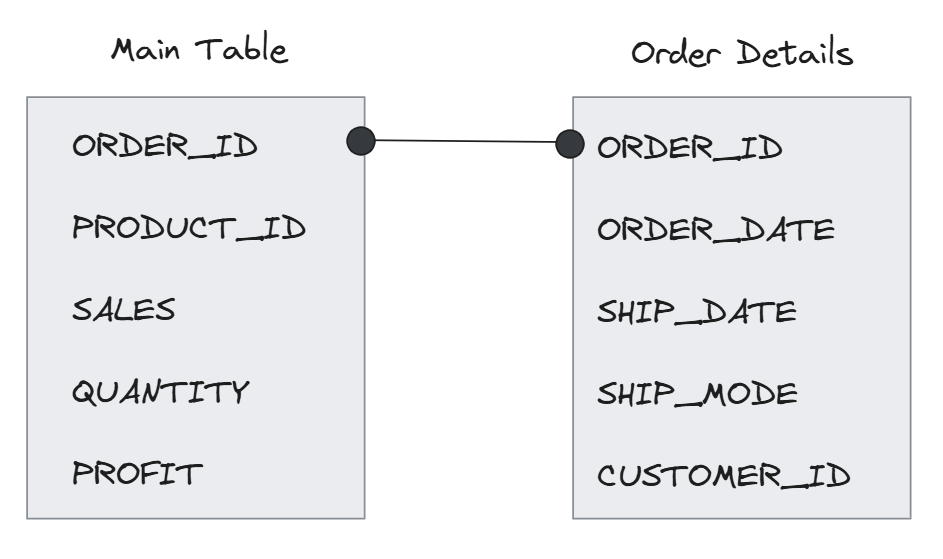
We could normalise this table by splitting it out into two tables. A main table is required to maintain the granularity of the dataset - this main table will detail the products in each order and product specific information. The other table will contain the ORDER_ID level data (ie. the fields that currently contain redundant data as they are the same for all products in an order), and will have 1 row per ORDER_ID. We can then create a relationship between the tables.


Benefits of Normalised Data
- Reduced storage costs.
- Increased consistency - databases and the tables within them have a standardised structure and the granularity of each table is clear.
- Simplified update process - fields in a normalised database usually only have to be updated in one table, so there there is less risk of inconsistent updates.
Benefits of Denormalised Data
- Quick to query.
- Data loads quickly, providing better performance on dashboards.
- Simplifies reporting and analysis tasks as all the information required is already in one place.
