


Have you ever opened a dataset and realised it’s just not in the shape you need for your analysis? Maybe you have months as column headers, or survey questions stacked in rows. In Tableau Prep, one of the most powerful and beginner-friendly ways to fix this is by using the Pivot step. Whether you're preparing data for Tableau Desktop or just cleaning things up, pivoting can transform your workflow.
Why Pivoting Matters Pivoting is all about reshaping your data:
- Columns to Rows: Useful when you want to analyse time-series data, normalise product categories, or simplify messy spreadsheets.
- Rows to Columns: Great for restructuring long survey results, consolidating values, or creating wide views for comparison.
Knowing when and how to pivot helps you avoid unnecessary manual edits in Excel and ensures your data is ready for fast, flexible analysis.
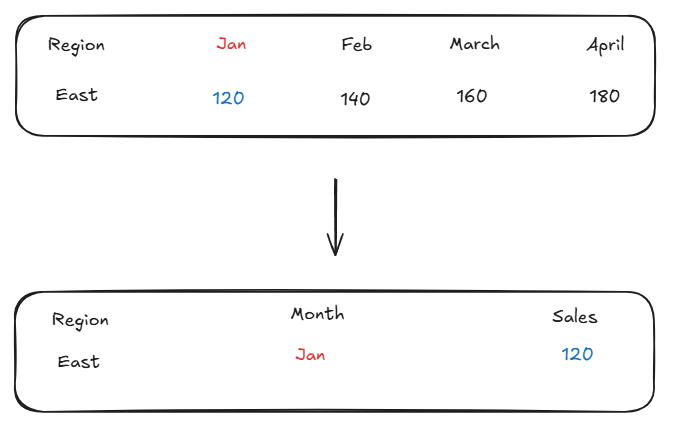
Scenario 1: Pivoting Columns to Rows
Example: You have sales data like this and want months and sales as separate columns.
Steps in Tableau Prep:
1)Add a Pivot step.
2)Select Columns to Rows.
3)Drag Jan, Feb, Mar into the Pivoted Fields area.
4)Rename Pivot1 Names to Month, and Pivot1 Values to Sales.
Now your data is in a clean, tall format perfect for a line chart in Tableau.
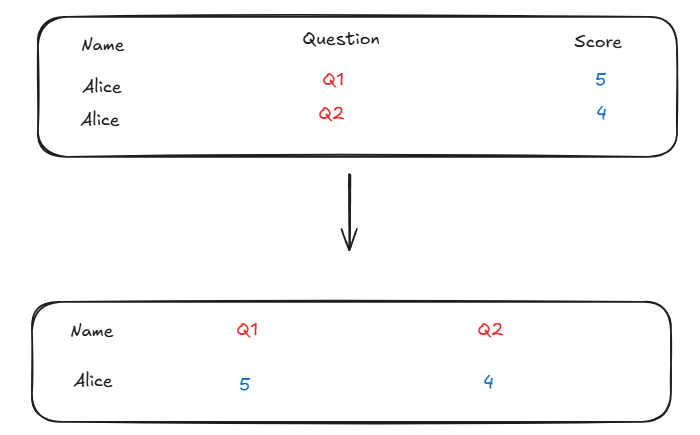
Scenario 2: Pivoting Rows to Columns
Example: You have survey data like below and want each persons name with their scores for each question as separate columns.
Steps in Tableau Prep:
1)Add a Pivot step.
2)Choose Rows to Columns.
3)Set Name as the grouping field.
4)Set Question as the field to pivot.
5)Set Score as the values field.
Now your data is ideal for comparing responses side by side.
What does the pivoting option look like in tableau prep?
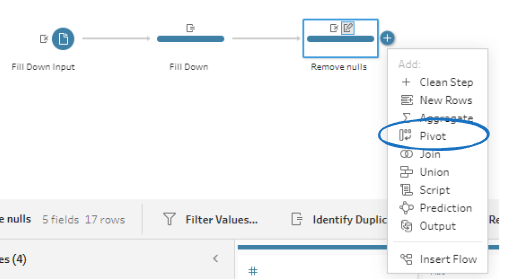
It's as simple as that!
Pivoting in Tableau Prep is a simple, visual, and powerful way to get your data into the right shape. Whether you're cleaning survey responses or preparing time series for analysis, learning how to pivot will save you time and supercharge your data prep skills. Try it out on your next messy spreadsheet — and watch your dashboard possibilities expand!