


If you’re new to Tableau (or data in general), the terms dimension, measure, continuous, and discrete might sound like a math class you didn't sign up for. But don’t worry — by the end of this post, you’ll not only understand them, but remember them for good. And we’ll have a little fun along the way too!
🎭 Meet the Cast: Dimensions & Measures
🔷 Dimensions = Descriptions
Dimensions are labels, categories, or descriptive information. They help you break down your data and answer questions like:
“Who?”, “What?”, or “Where?”
📦 Examples:
- Product Category
- Region
- Customer Name
- Order Date
💡 Think of dimensions as the "slicers" of your data pie. They don’t get measured — they organise what gets measured.
🔶 Measures = Numbers
Measures are quantitative values — the things you add, average, or compare. They answer:
“How much?” or “How many?”
📈 Examples:
- Sales
- Profit
- Quantity
- Discount
💡 Think of measures as the scores on your data scoreboard. They’re what you actually measure.
🧠 Memory Trick:
“Dimensions describe, measures quantify.”
Or even simpler:
“Dimensions = labels, Measures = numbers.”
🎯 Now Enter: Continuous vs Discrete
Now that you've got dimensions and measures sorted, let's talk about how Tableau treats them.
🟢 Continuous = Connected
Continuous fields are numeric or time-based values that flow smoothly. Tableau draws axes for continuous data because they have a range.
📊 Examples:
- Sales over time
- Age
- Temperature
- Profit %
💡 If your data fits on a number line, it’s continuous.
🔵 Discrete = Distinct
Discrete fields are individual categories or chunks. Tableau treats them as labels, not scales. Instead of drawing an axis, it creates headers.
📊 Examples:
- Region
- Customer Segment
- Year (as a category)
- Product Name
💡 If your data fits in a dropdown list, it’s discrete.
✅ Easy Way to Remember:
- 🟢 Continuous = Green pill in Tableau
- 🔵 Discrete = Blue pill in Tableau
- ✅ Continuous = range (graph scale)
- ✅ Discrete = category (group labels)
🔢 The Four Possible Field Combos in Tableau
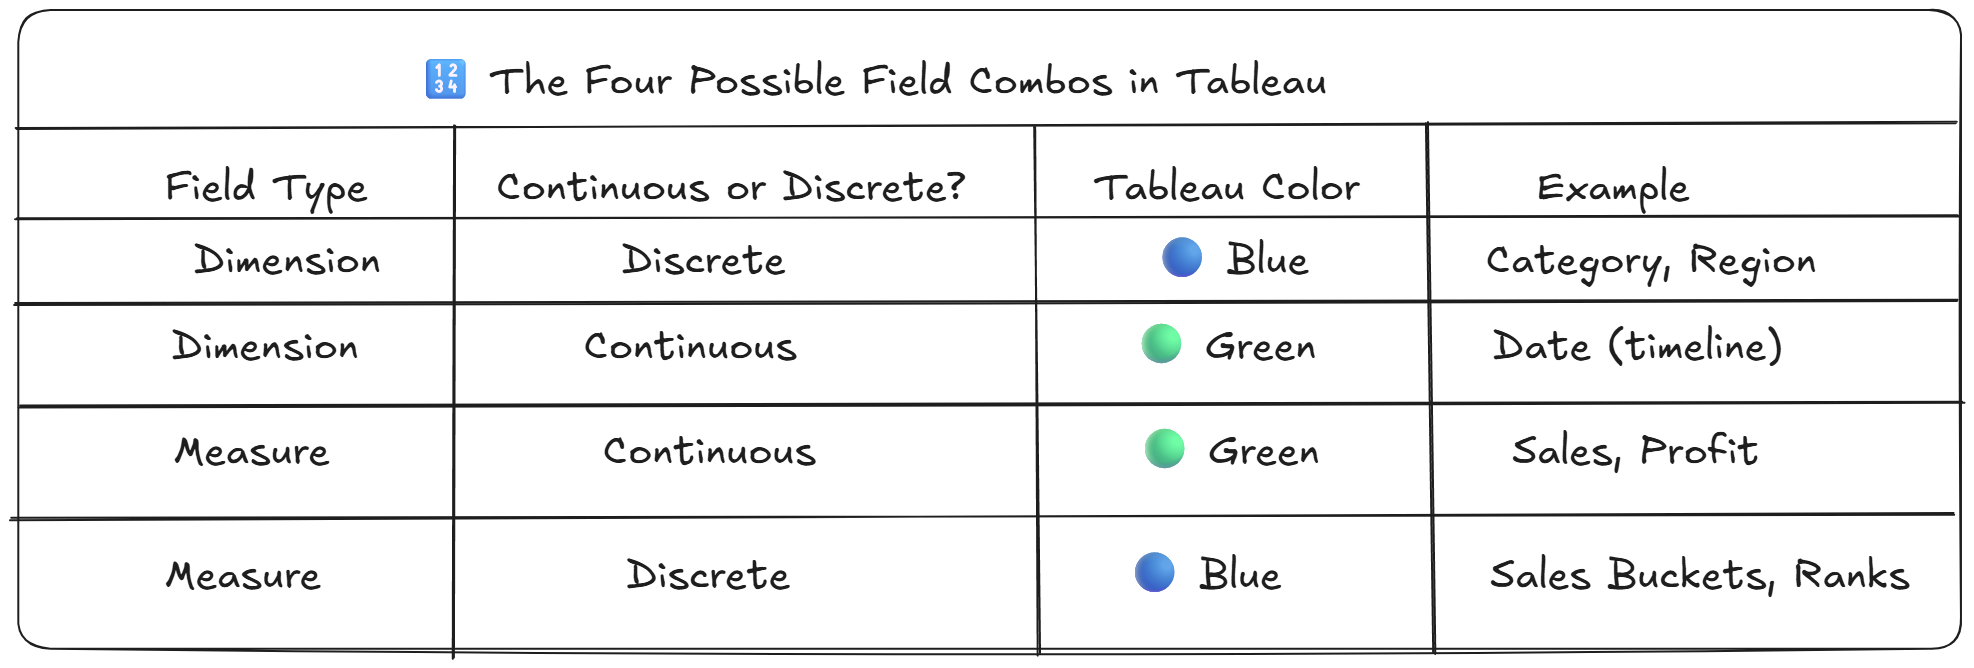
🧠 Yes — measures can be discrete too, like when you bucket sales into tiers (Low, Medium, High).
🧁 Analogy Time: Cupcakes & Customers
Imagine you own a cupcake shop and track your orders:
- Dimensions: Flavour, customer name, day of the week
- Measures: Number of cupcakes sold, total revenue
- Discrete: Cupcake flavour (e.g., Chocolate, Vanilla)
- Continuous: Daily revenue, outside temperature
See how it works? Some data describes, some data measures — and some flows while others group.
🛠 Bonus Tip: Switching Between Continuous & Discrete
In Tableau, you can right-click any field and choose to convert it:
- Use Year (Discrete) to compare bars by year
- Use Year (Continuous) to create a timeline
Choose based on how you want to group or trend your data!
🎉 Conclusion: It’s Not That Complicated!
Understanding dimensions vs. measures and discrete vs. continuous is a big step toward mastering Tableau. The best part? Once you know what question you're trying to answer, the right data type and visual will follow naturally.
Just remember:
- Dimensions = Labels
- Measures = Numbers
- Discrete = Groups
- Continuous = Flows
With these building blocks, you’re not just making dashboards — you're telling smart, strategic stories with your data.