


One of the best ways to establish yourself as a data analyst is to showcase portfolio projects on GitHub. However, after building a few projects, it’s easy to hit a wall when trying to come up with fresh ideas. While platforms like Google Dataset Search and Kaggle are great for curated datasets, GitHub itself is an underrated goldmine for project inspiration and learning resources, especially if you know how to use GitHub Topics.
What Are GitHub Topics?
GitHub Topics are text-based tags that allow developers to categorize their repositories and discover similar work across the platform. You can add multiple topics to your own repositories and filter searches by combining different tags. For data professionals, searching topics related to data analysis and analytics engineering is a great way to uncover trending tools, datasets, and project architectures.
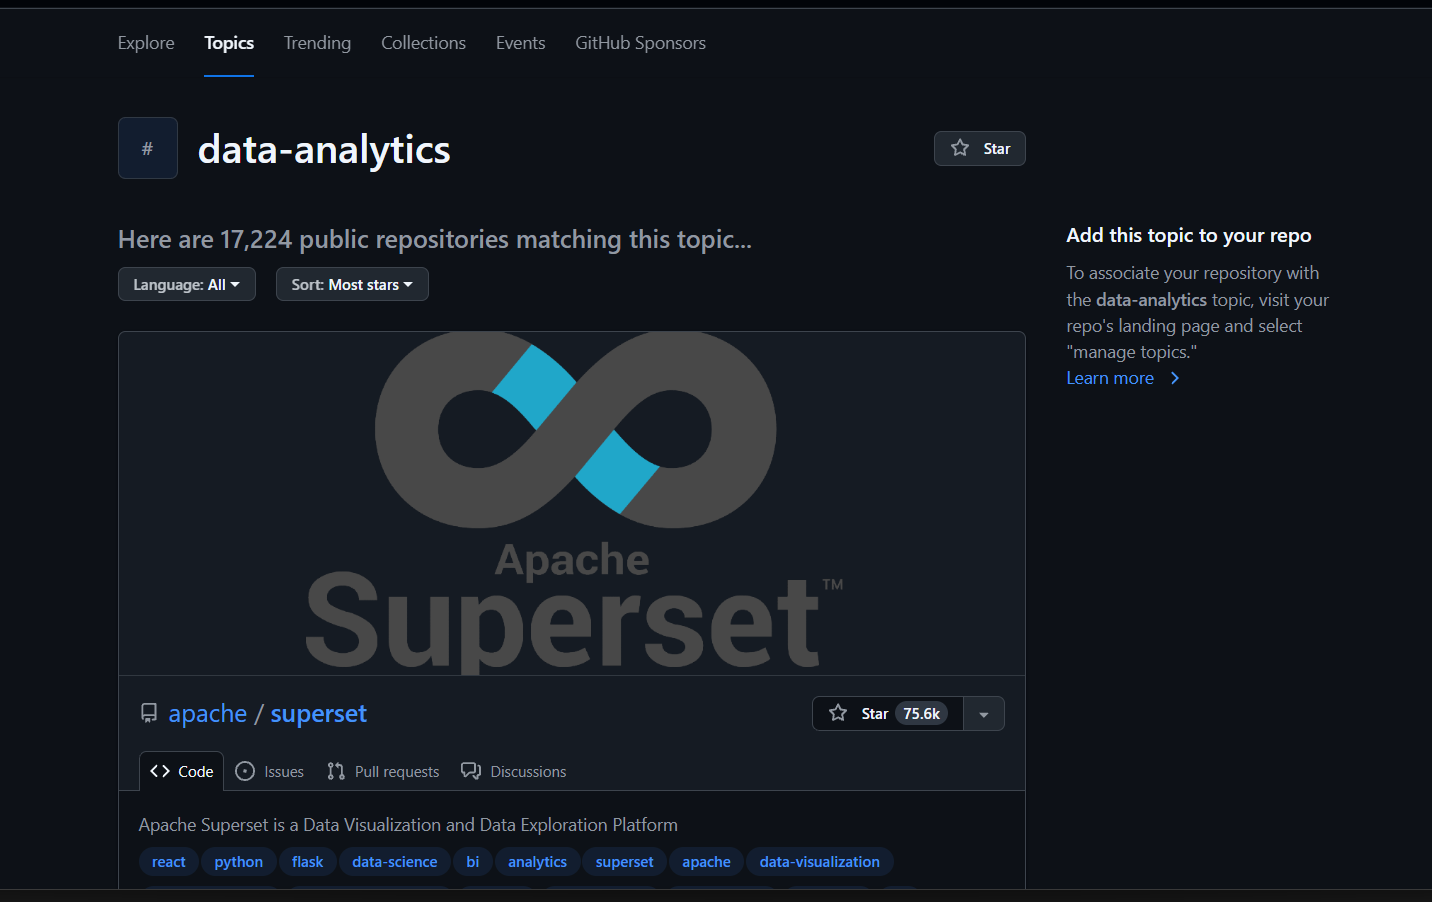
For example, searching the 'data-analytics' topic yields tens of thousands of repositories, surfacing tools like Pathway for building Python ETL pipelines.
If you are looking specifically for portfolio inspiration, searching 'data-analytics-project' reveals hundreds of Github repos and projects. Browsing through how others structure their code and solve problems can spark new ideas and introduce you to unfamiliar libraries.
Leveraging Github Topics
Finding New Datasets
Beyond code, GitHub hosts several community-maintained directories of open data:
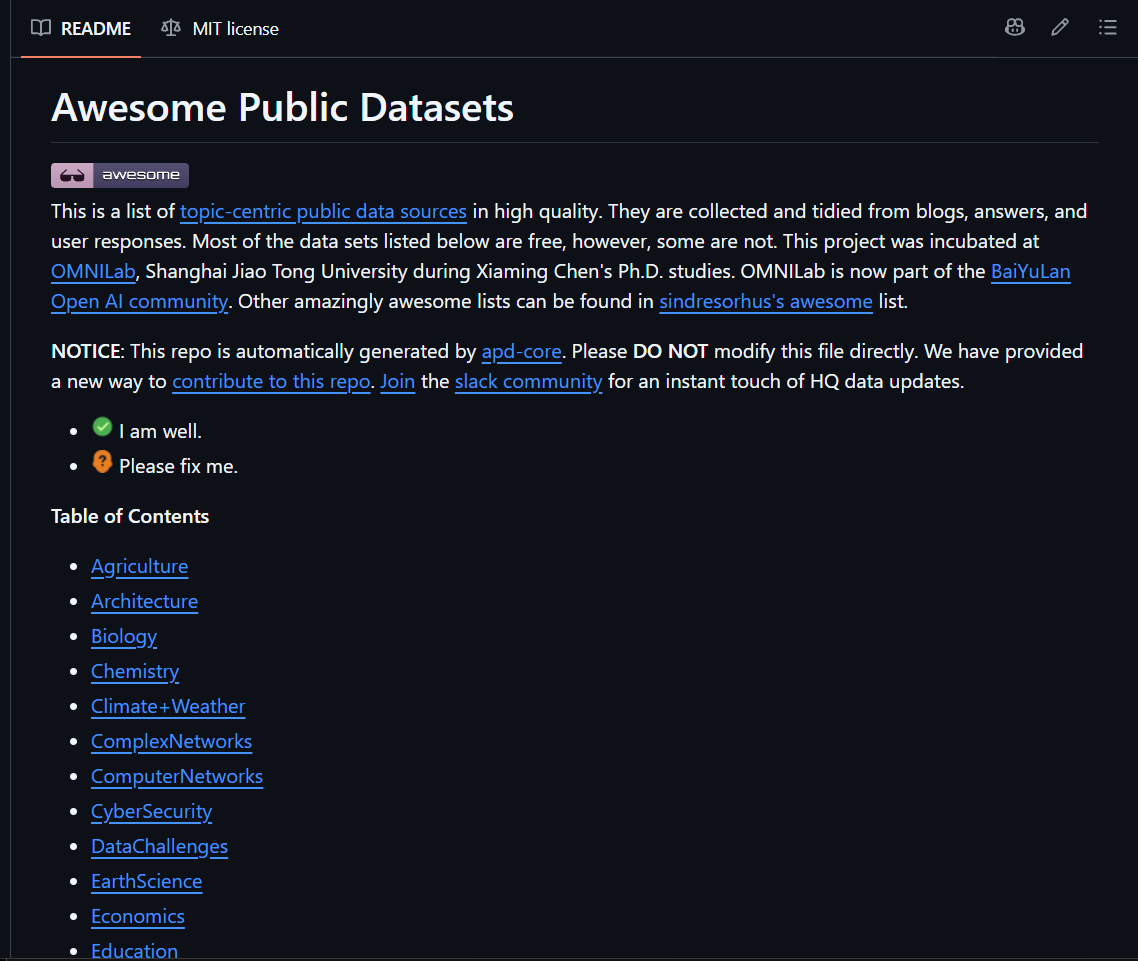
Awesome Public Datasets: Maintained by awesomedata, this repository curates over 100 high-quality public datasets grouped by domain, spanning everything from tea production to eSports. Each entry includes metadata links and notes on data quality. It is especially valuable for those interested in life sciences where accessible public data can be difficult to source; offering extensive datasets covering cancer research, microscopy tissue slides, genomics, and proteins.
Leveling Up Your Skills
If you want to sharpen your technical foundation or explore new architectures, GitHub also hosts comprehensive learning resources:
Microsoft’s Data Science for Beginners: This repository offers a structured curriculum with over 20 lessons covering data science fundamentals, including SQL, Python, and cloud-based data workflows. It also includes built-in quizzes if you are looking for a quick refresher or want to test your knowledge.
Awesome Big Data: If you want to learn how to work with 'Big Data' (literally), this curated list covers frameworks, SQL processing engines, and data modeling techniques (such as graph and key-value models). It’s great when deciding how to handle data processing; covering both batch processing and streaming.
Building Interactive Dashboards with Code
As data analytics shifts toward greater interactivity, analysts are increasingly adopting software engineering practices to build custom, flexible dashboards rather than relying solely on traditional BI tools.
Python is a natural fit, allowing you to handle both data processing and web app development in a single language:
- Core Data & Plotting: Open source libraries like NumPy, pandas, and Matplotlib handle data manipulation and static visualizations.
- Web Apps: Streamlit lets you turn Python scripts into interactive, shareable dashboards without needing frontend web development experience.
- Drag-and-Drop Exploration: PyGWalker bridges the gap between code and traditional BI by embedding a Tableau-style visual interface directly inside your Jupyter Notebook or Python environment.
If you prefer working in JavaScript or need client-side execution, libraries like Danfo.js bring pandas-like data structures and browser-based visualizations directly into the JavaScript ecosystem.
Github isn’t just the place to host your portfolio. It also can be a source of inspiration and learning. I hope you can look at Github with new eyes and explore all that it has to offer on your journey.