Hey, welcome back to Charted Territory, or rather, Recharted Territory!!! Yes, I’m still proud of the pun, can you tell? 😛
This entry is a continuation of last time’s, to finish explaining the process behind the chart swap. As a reminder, I broke up the process into five components: planning/setting up, creating the controls the user will use to interact with the dashboard, connecting the controls to the visualizations, making the title change with the visualizations, and putting them onto the dashboard. Today, I’ll be explaining how to make the dynamic chart title and putting the charts together on the dashboard.
Using the same diagram from last time, I’ve colored in the parts we’re going to work on today; again, this diagram shows how everything is connected, not the order in which we did all of it:

The Process (#4-5)
#4: Making the Dynamic Chart Title
1. We’ve already done the bulk of it; we have our charts, our parameter, our filter with the calculated field that connects the charts to the parameter – now, let’s make our title change with the visualization(s).
Start by creating another calculated field.
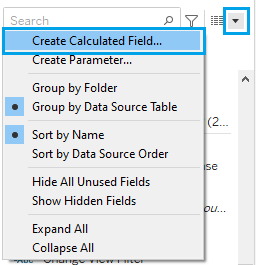
2. Now, we’re going to use a logical calculation (CASE, which is like an IF/THEN statement, just more concise) to have the title change depending on the condition. In this case, the values in the Change View parameter are the conditions.
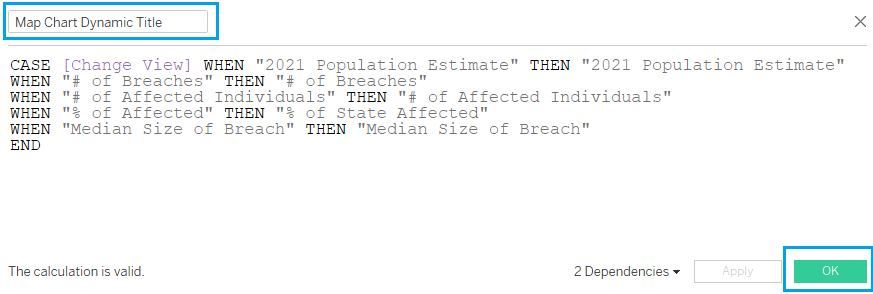
What’s going on here? This is saying, when the value in the Change View parameter equals “2021 Population Estimate” (i.e., when “2021 Population Estimate” is selected), then return the value “2021 Population Estimate,” and so on and so forth.
Note that the Map Chart Dynamic Title calculated field is connected to the parameter, and the Change View Filter calculated field (the one that connects the worksheets to the parameter’s list of values) is connected to the parameter. The parameter is the common denominator here that enables the chart title and visualizations to change together (refer to above diagram).
3. Drag the Map Chart Dynamic Title calculated field to Text on the Marks Card.
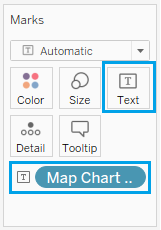
4. Format the text (color/size/font/alignment/etc.).
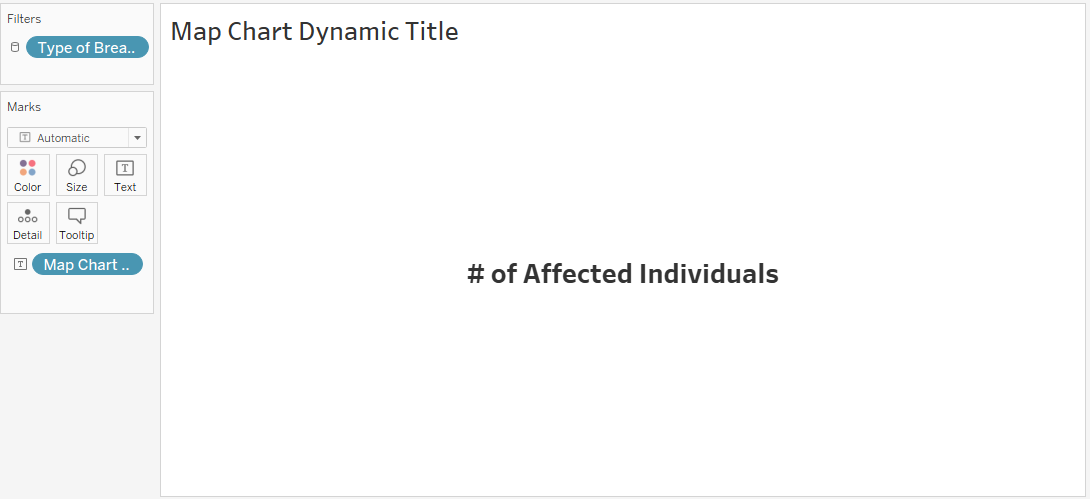
5. Switch from Standard to Entire View.

Hooray! The end result will look something like this:
#5: The Dashboard
We’re on the home stretch now! It’s time to put everything together on the dashboard!
You already know what I’m going to say… make sure you’ve arranged all your containers first!!!
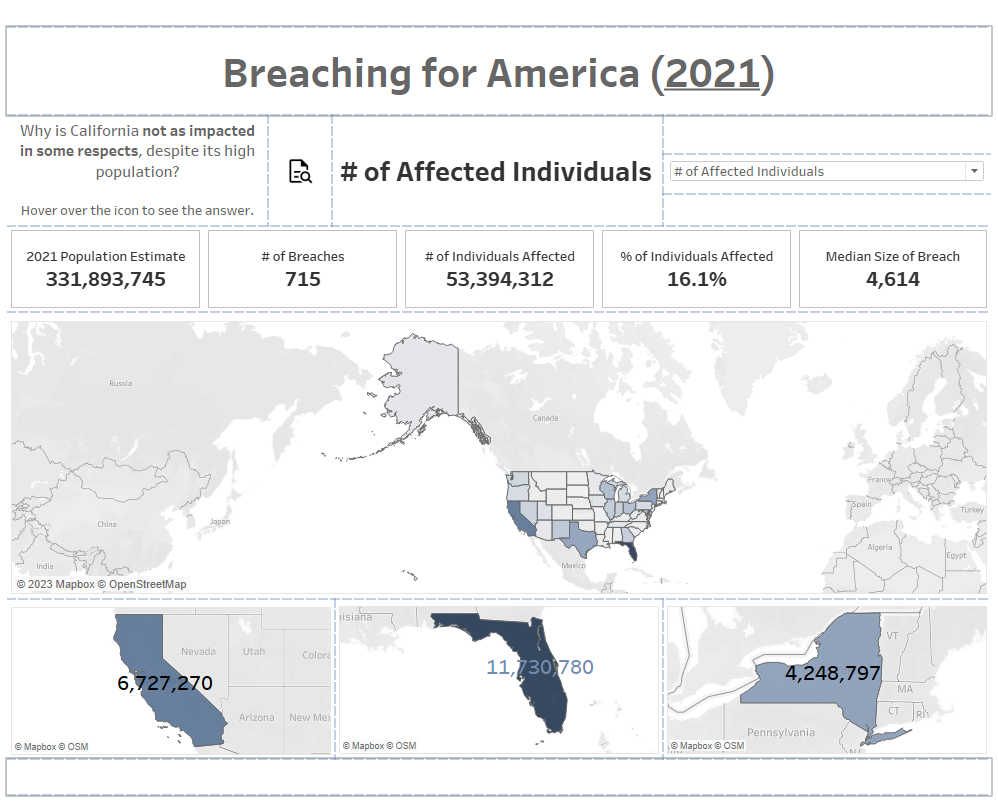
I hovered over my dashboard so you can see how many containers there are (look at the dotted line outlines). You can also see where I’m lacking some containers due to mistakenly thinking at first that blanks and containers worked the same way, and while I’m happy with how the dashboard eventually turned out, rearranging/readjusting/resizing elements was a huge pain, so please heed this cautionary tale, if nothing else.
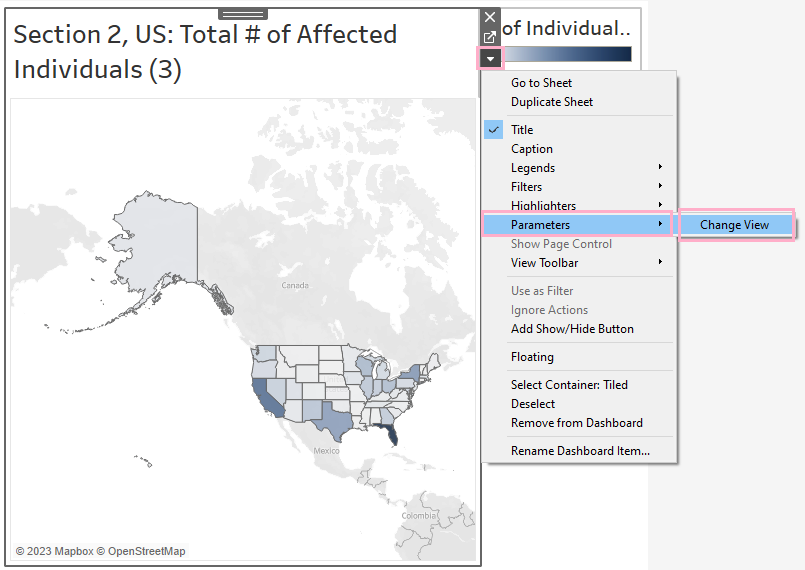
2. Next, drag one of the visualization sheets and the dynamic title sheet to the dashboard. We already clicked Show Parameter to make it visible to the right of the worksheet in the last entry, so the parameter should also pop up on the dashboard alongside the visualization sheet.
If not, click on the visualization sheet, then the upside-down triangle. Select Parameters from the drop-down, and then the name of the parameter.
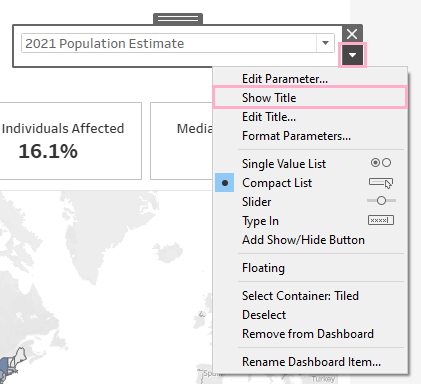
3. You can also deselect Show Title to hide the parameter’s title via the same drop-down menu.
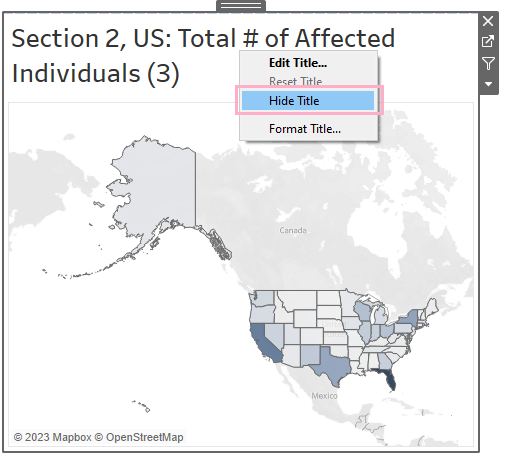
4. Right-click on both worksheets’ titles, and select Hide Title.
5. Drag in the next sheet into the same spot as the first visualization sheet, and select Hide Title again. In my case, I have the U.S., California, Florida, and New York maps laid out in four different spots, and am dragging all U.S. maps to where the first U.S. map was placed, all California maps to the first California map, etc. (and making sure to hide each sheet’s title before dragging in the next chart).
Remember, the Change View parameter is controlling which charts are visible, so when you hide the title, and the value selected from the parameter doesn’t match the value associated with the visualization sheet, the particular spot you’re in the middle of putting together will look blank as you’re dragging the sheets there, which is normal (and what you want).
Once you’ve placed all the visualizations where they should be, the only visible visualization(s) will be the one that matches the parameter’s selected value.
Again, I have twenty maps and one sheet for the dynamic chart title, so in total, I hid the title twenty-one times. The dynamic chart title and maps took up five different places on the dashboard; the dynamic chart title had its own spot, and then the other four spots were for all the U.S., California, Florida, and New York maps.
Here's a diagram showing just the parameter-related worksheets:
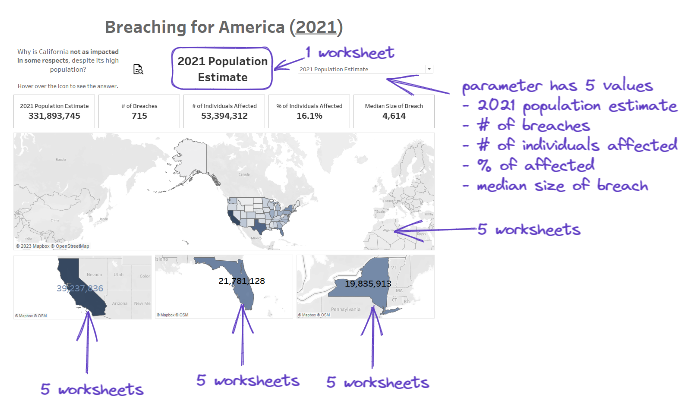
Now that everything’s been put together, whenever you select something from the drop-down, the title will change, as well as the four maps, allowing for side-by-side comparisons of the impact of HIPAA breaches on those locations.
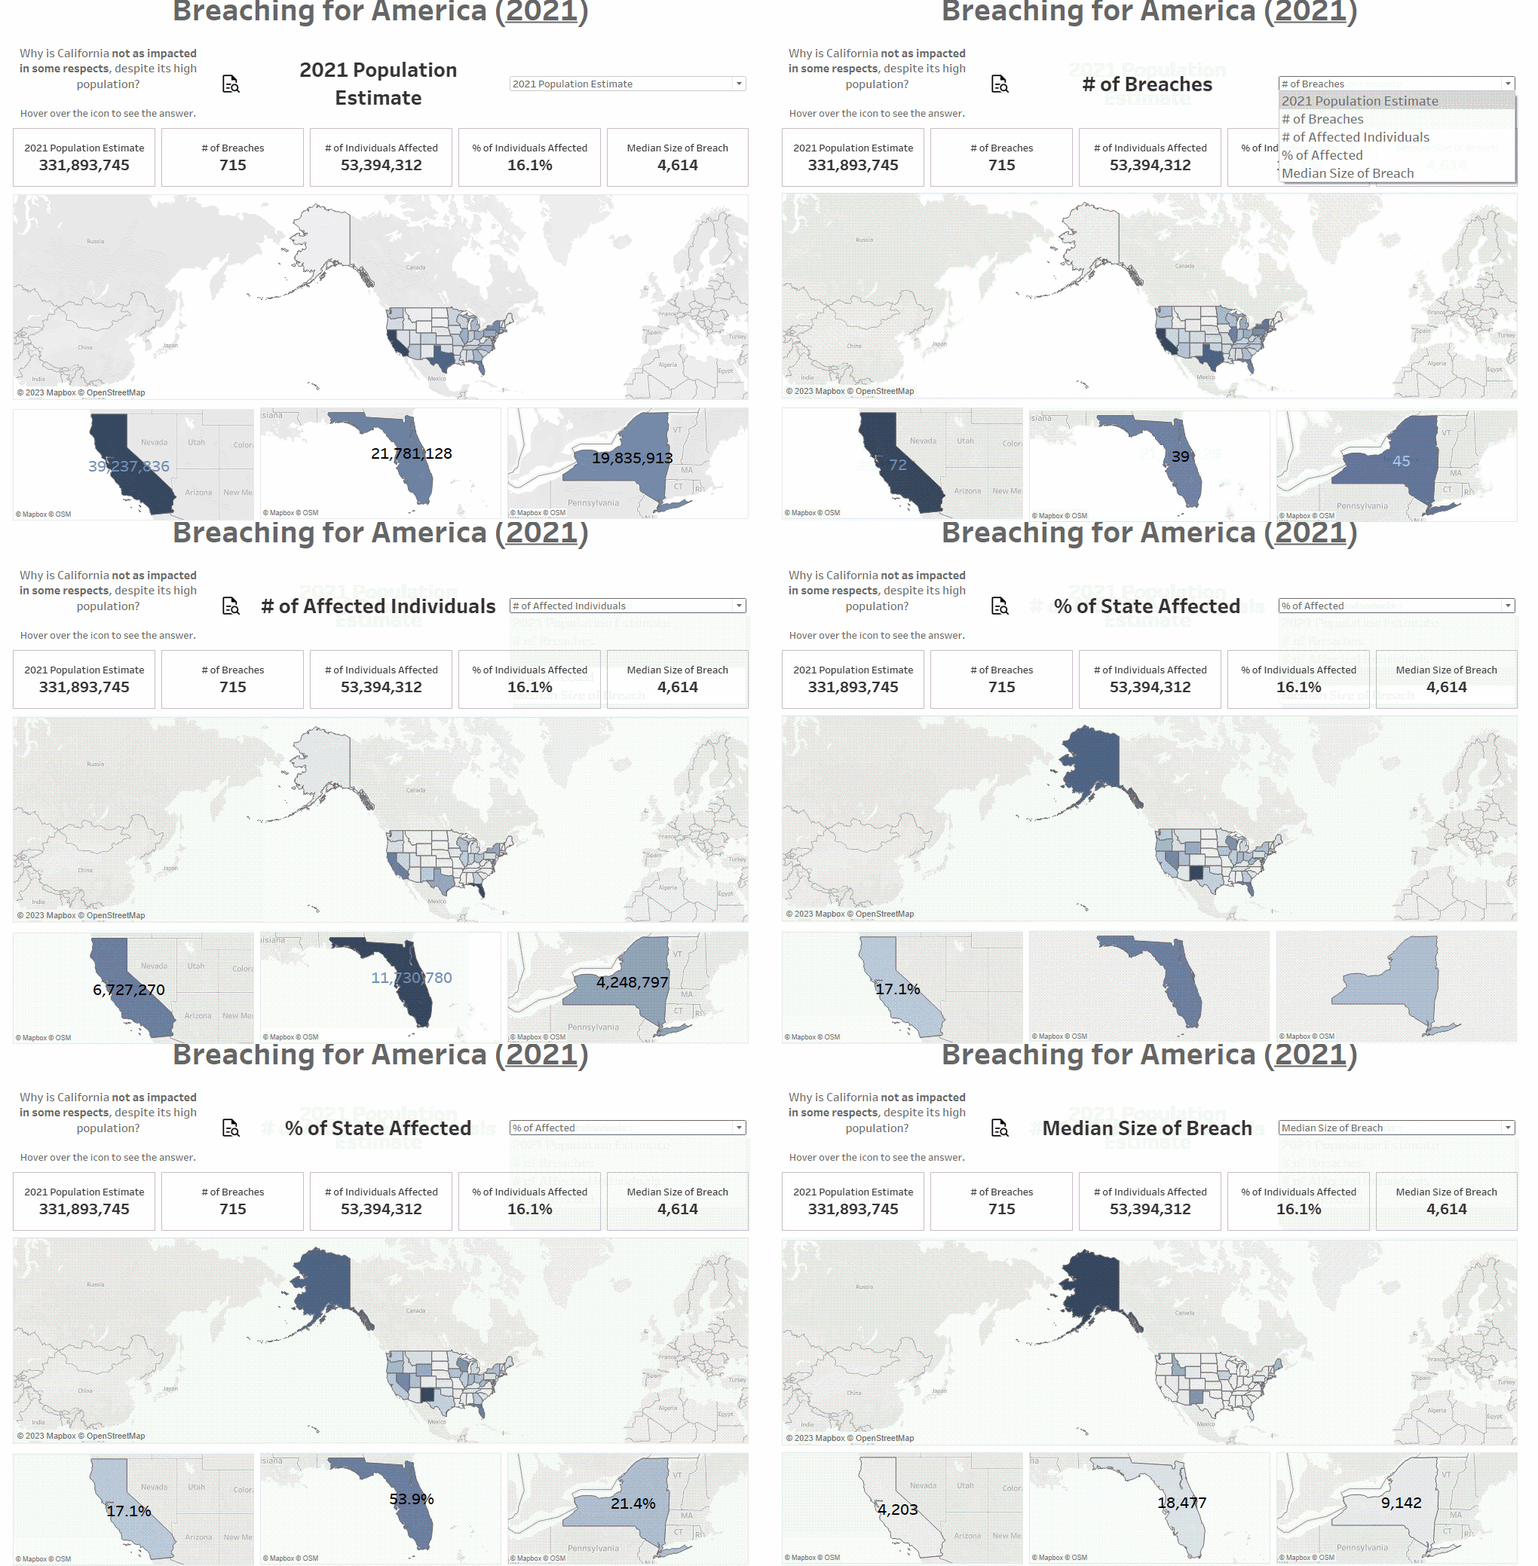
Learning how to do the chart swap made me realize just how much you can do with calculated fields and parameters – and just how much you can do with Tableau in general, and I hope you got that impression, too! See you next time!
