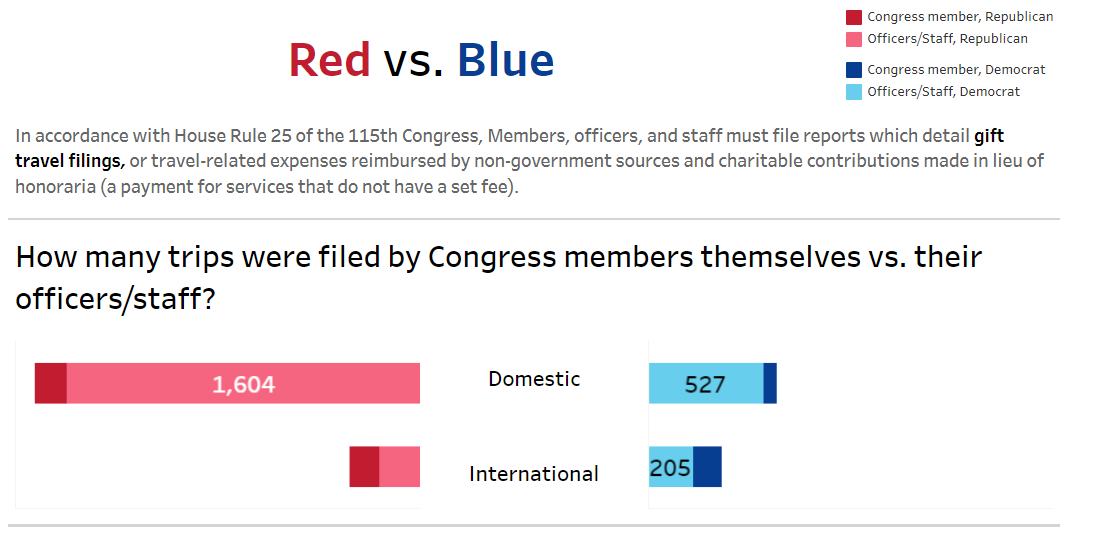
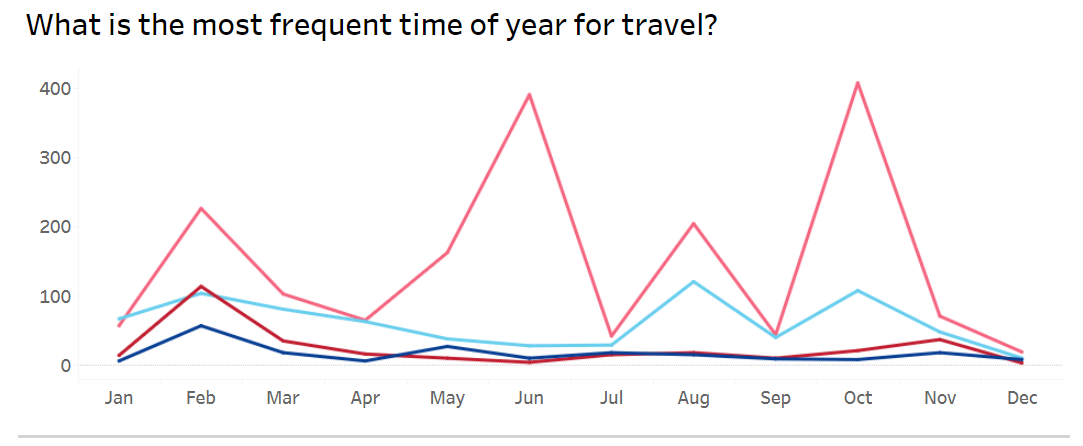
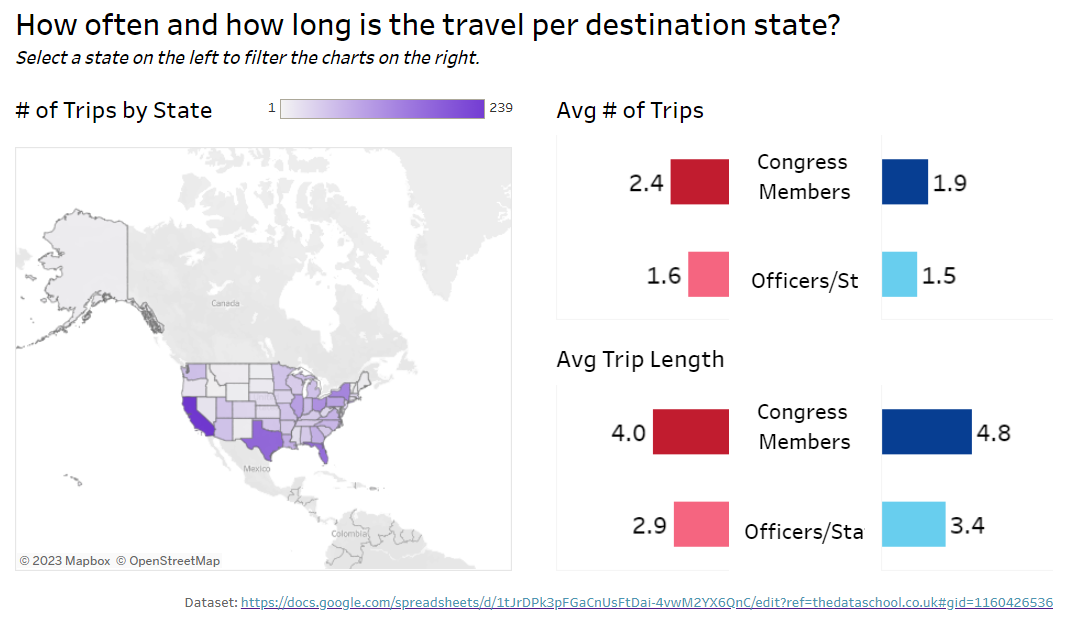
Last day of Dashboard Week! Today, we were assigned the same dataset the incoming DSNY4 cohort analyzed for their final application viz: gift travel filings! I’d had the title in my mind for a while (Red vs. Blue) and was eager to get started, analyzing the gift travel filings by political party, type of travel (domestic vs. international), and type of travel filer (Congress member themself, or other officers/staff).
The dataset didn’t have the individuals’ party affiliation information, and my analysis hinges on it, so I gathered information from Ballotpedia, Wikipedia, and other sources to create a lookup table.
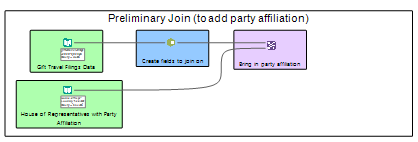
Below are my workflows:
1. The preliminary join to bring in party affiliation, which was when I realized many were missing:
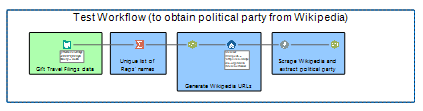
2. A test workflow to extract party information from Wikipedia:
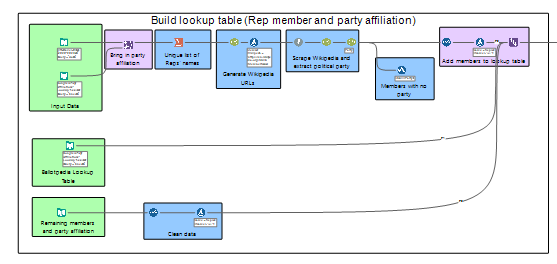
3. Another workflow to build the lookup table:
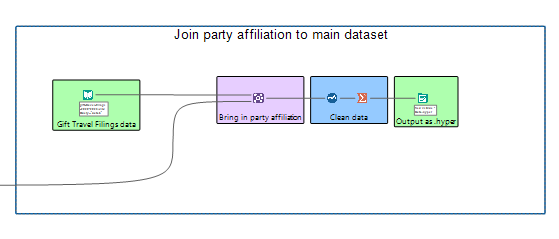
4. And a final workflow to join the lookup table to the main dataset:
I still felt a bit pressed for time today, but less so than the other days. Here’s my dashboard–time to add in some finishing touches and work on my presentation!