For the third day of Dashboard Week, we needed to scrape the Bundesliga website for 20 (or more) seasons’ worth of data. We also had to create an exploratory dashboard after cleaning up the data.
There were three parts to my workflow:
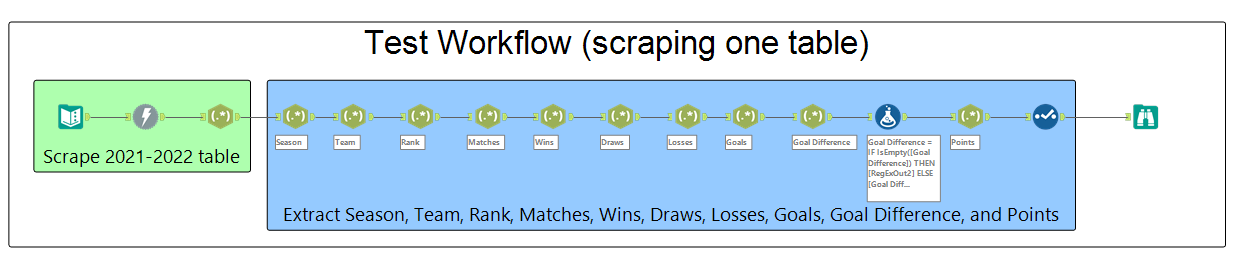
1. Test Workflow (for scraping one season only)
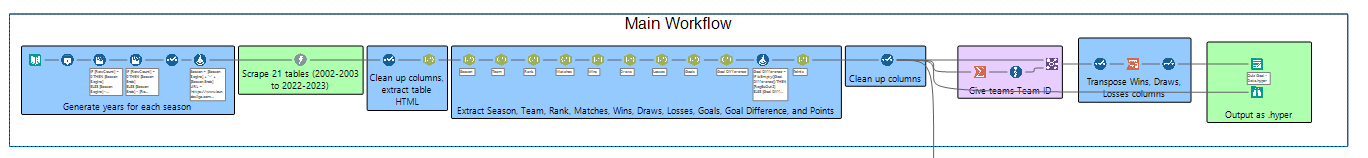
2. Main Workflow (for scraping 21 seasons’ data)
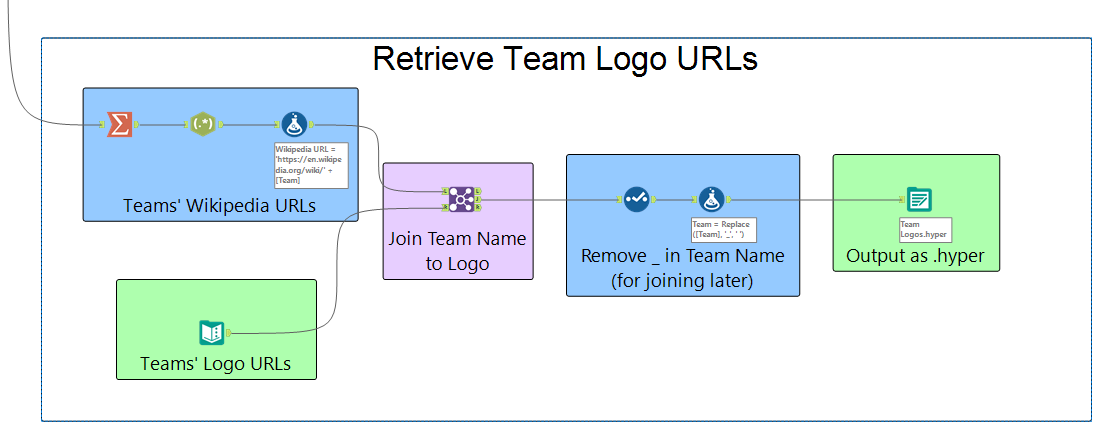
3. Logo Workflow (for acquiring images of all the logos from Wikipedia)
I don’t know much about sports–the closest thing I could think of in relation to sports was Pokemon, and my thoughts turned to making trading cards for teams.
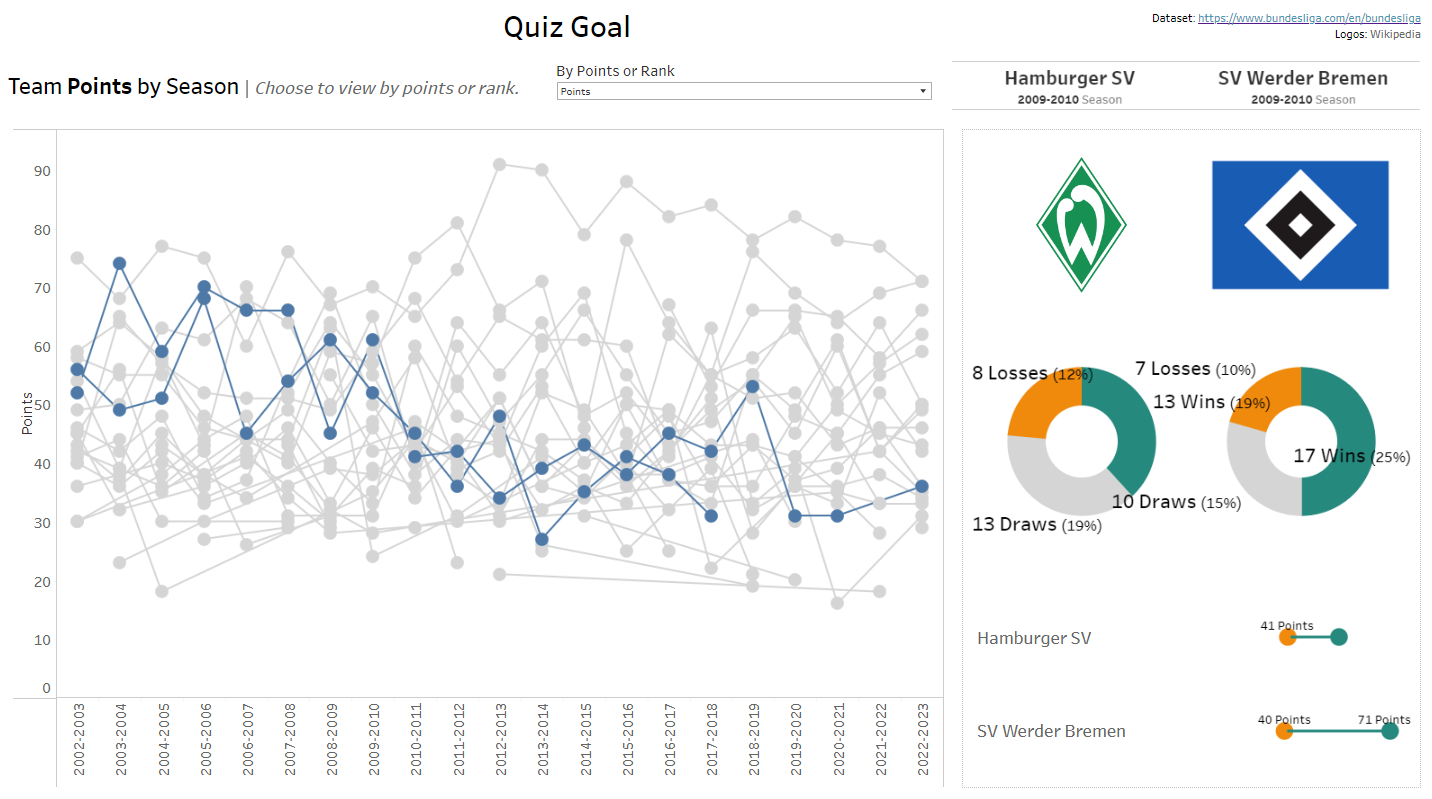
Here’s my dashboard. I felt pressed for time again, but I think I was better at following my schedule today. Maybe the third time will be the charm!