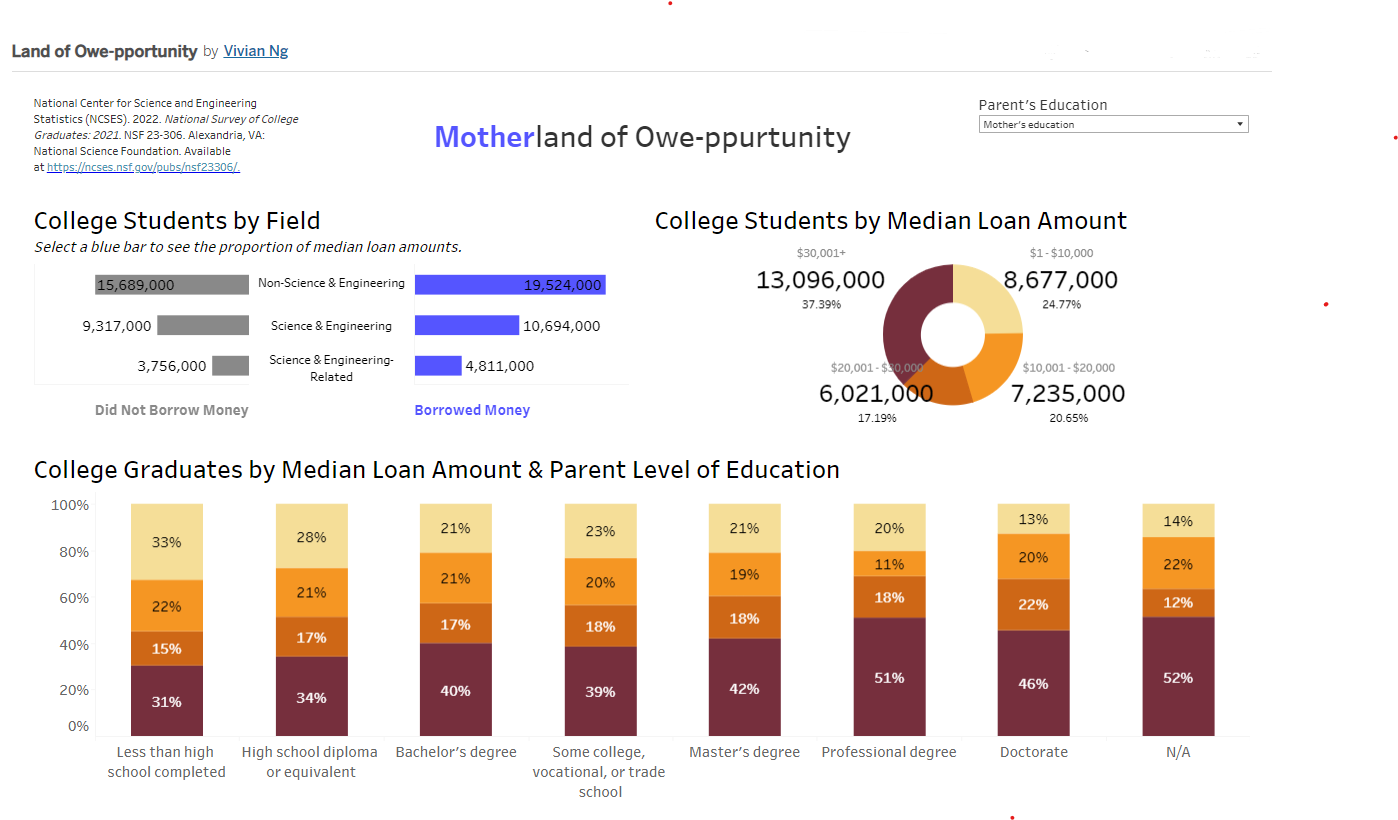
Today’s the second day of Dashboard Week, and we analyzed National Survey of College Graduates 2021 data. I sought to learn more about college graduates and the median amount they borrowed to finance their undergraduate degrees, in relation to their mother or father’s level of education.
Specifically, my questions were as follows:
- Which fields did college graduates major in the most for those who borrowed vs. those who didn’t?
- For the college graduates who borrowed money to finance their degrees, what proportion of them borrowed a median amount of $1–$10,000; $10,001–$20,000, etc.?
- Does the median amount college graduates borrowed decrease with their mother/father completing higher levels of education?
Before dashboarding, I had to clean the data as there were hierarchies of data nested within each major/broader field of study (science and engineering, science and engineering-related, and non-science and engineering) with Alteryx.
Here’s what the flow looked like:

As I built the dashboard, I realized I couldn’t make any assumptions about college graduates’ parents (whether they were from a two-person household, the two parents were a mother and father, etc.), so I looked at father’s vs. mother’s level of education separately (filter located at top-right corner).

I had made a schedule for today, but I got caught up in data cleaning, so I ended up feeling a bit pressed for time. Tomorrow, I’m going to be more attentive to the clock!
