


[on Parameters & Calculated Fields]
I didn’t realize until I was building my DSNY application dashboard just how powerful calculated fields used in conjunction with parameters can be (e.g., chart swap section titled “Breaching for America”). For that specific section, after learning more about parameters and calculated fields here at DSNY, I realized I could have utilized parameters to let the user switch measures as opposed to entire charts, which would have cut down on loading time for the user (and saved me some time, since I’d built 20 different charts for that section alone).
In the following example, I’m going to talk about how to make a parameter that allows the user to switch out the measure they’re looking at in Tableau’s sample dataset Superstore. It got a bit cut off, but below is a GIF demonstrating how the user can click on different measures to see the Sales, Profit, and Quantity for each customer.
Anyway, let’s get into it now!

Parameter + Metaphor = Parametaphor
First off, what is a parameter?
It’s a group of values that the user can choose from to change the visualization. Parameters allow the user to interact with the visualization, facilitating exploration and analysis of the data. For example, if you have sales data and want to see which product categories have reached the target, you can incorporate a parameter that allows the user to change the target.
Parameters don’t do anything on their own; they need to be connected to calculated fields that are then used in the view in order for the user to be able to change the visualization.
Not a perfect metaphor, but to understand how parameters connect to visualizations, I imagine an unplugged TV (view/visualization) and its remote (parameter). Since the TV is unplugged, pressing the buttons on the remote won’t do anything to the TV, similar to how just creating the parameter won’t change the view (yet).
It’s not until you plug in the TV that the TV and remote are now connected. Granted, the reason the TV wasn’t working with the remote was because it previously didn’t have a power source, but the important thing to remember here is you need to establish that connection between the two before acting on one (the remote/parameter) will impact the other (the TV/view).
The Process
Creating a Basic/Static Visualization
1. Let’s start with creating a basic visualization, as I found it easier to wrap my head around the concept of parameters once I had something (static) in the view. Once I saw the static version of what I wanted to build, swapping out a static element for a dynamic one became much easier to understand.
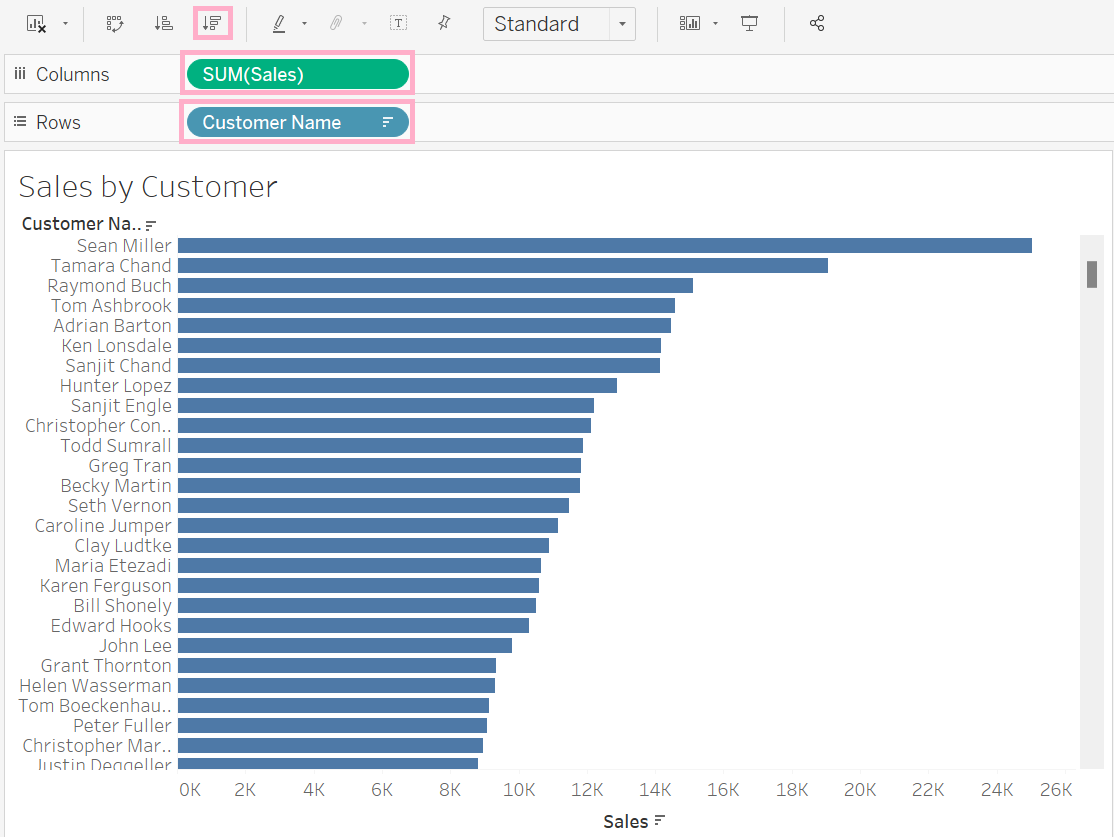
Drag Sales to the Columns Shelf and Customer Name to the Rows Shelf. Let’s also sort it in descending order to make it easier to look at, by clicking the icon above the shelves.
Now we have a bar chart showing the total sum of Sales by Customer.
2. You can also start doing some formatting here, like removing the gridlines, but you can also wait until the very end.
Creating a Parameter
1. Now, let’s create the parameter (i.e., the user’s controls). Click on the upside-down triangle next to the search bar at the top of the Data Pane, and select Create Parameter…

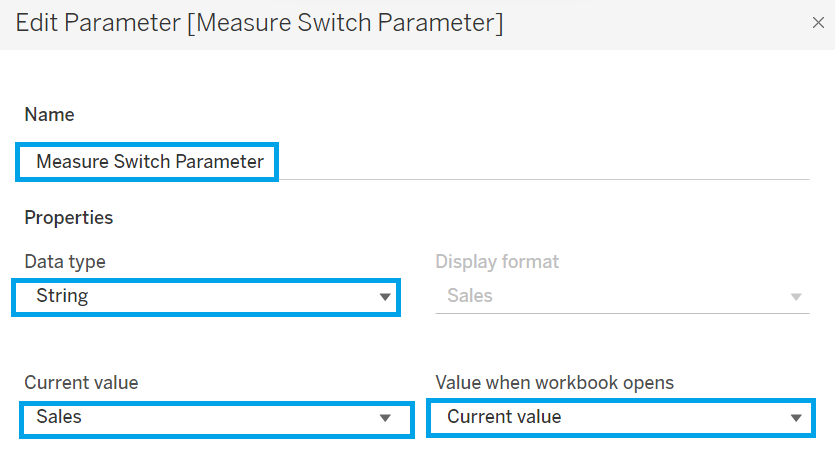
2. A window will pop up, allowing you to customize the parameter. Give the parameter a descriptive (but succinct) name. I recommend tacking on “Parameter” at the end of the name because while you can scroll down the Data Pane to access the parameters, calling it a “____ Parameter” will allow you to find it via typing in the search bar at the top of the Data Pane as well.
Names of measures (what the user will be selecting to change the visualization) are strings, so the data type is String. You can also choose the value the user sees upon first opening the workbook.
3. Since we’re going to have the user select a measure from a list, for Allowable values, select List, and input the values for the list.
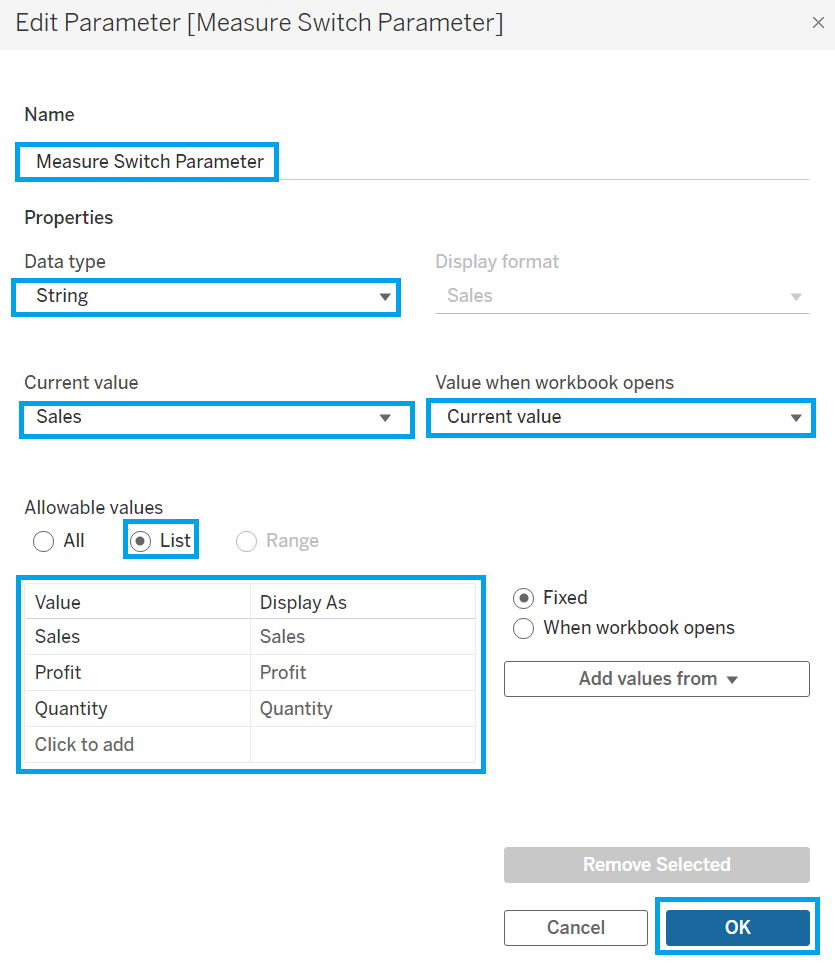
4. Finally, hit OK.
Creating the Calculated Field
1. Remember, the parameter won’t do anything on its own. It needs to be connected to a calculated field in order for the visualization to change, so let’s create one!

2. We want the specified measure to appear in the visualization only when the user chooses it, i.e. on a condition, so we need an IF statement in the calculated field that connects the parameter to the view.
In plain English, this calculated field says: When the value ‘Sales’ is selected on the parameter, give us the sum of ‘Sales’. (Remember, because we’ll be setting up the view before the user sees it, we won’t just be getting back a number.)
Rebuilding the Visualization with the Parameter
1. Now that we have all the pieces (i.e., the parameter and the calculated field), let’s put them together—by putting the calculated field containing the parameter in the view!
Go back to the visualization you already built, and replace the measure on the Column Shelf with the Measure Switch calculated field.
2. Don’t forget to make the parameter visible! In order to do that, right-click on the parameter and click Show Parameter. (Refer to the GIF at the very beginning to see the end result.)

3. Format the parameter to the user’s needs.
Ta-da! There you have it! There’s still some cleaning up of chartjunk to do, and perhaps this visualization would best be placed next to others in a dashboard to provide context, but for the moment, we have completed our objective of allowing the user to switch between different measures without having to scroll down a lot to see all the different charts—and also without having to make so many charts on my part (which also saved some processing time).
Until next time :)