


In this blog, I’ll walk through how I took a raw dataset on AI’s impact on student life, broke it into a star schema, and connected it to a user story.
I began with a flat Excel dataset that looked something like this:
- Student_ID
- Age
- Major
- Primary_AI_Tool
- Task_Frequency_Daily
- Main_Usage_Case
- GPA_Baseline
- GPA_Post_AI
- Time_Saved_Hours_Weekly
- AI_Ethics_Concern
- Career_Confidence_Score
At first glance, this looks analysis-ready, but it’s actually not ideal for scalable analysis.
The problem with flat data:
- Repeated values (e.g., Major, AI Tool)
- Harder to maintain consistency
- Not optimized for tools like Tableau
- Limited flexibility for future questions
Step 1: Defining the User Story
To make this feel real, I framed it around a stakeholder:
As a university program director, I want to understand how students are using AI tools and how that impacts their academic performance, time efficiency, and career confidence, so that I can guide policies, resources, and training around responsible and effective AI usage.
Once you define the user story, everything else becomes clearer:
- What tables you need
- What metrics matter
- What relationships are important
Step 2: Breaking the Data into a Star Schema
I started by splitting the dataset into a fact table and multiple dimension tables.
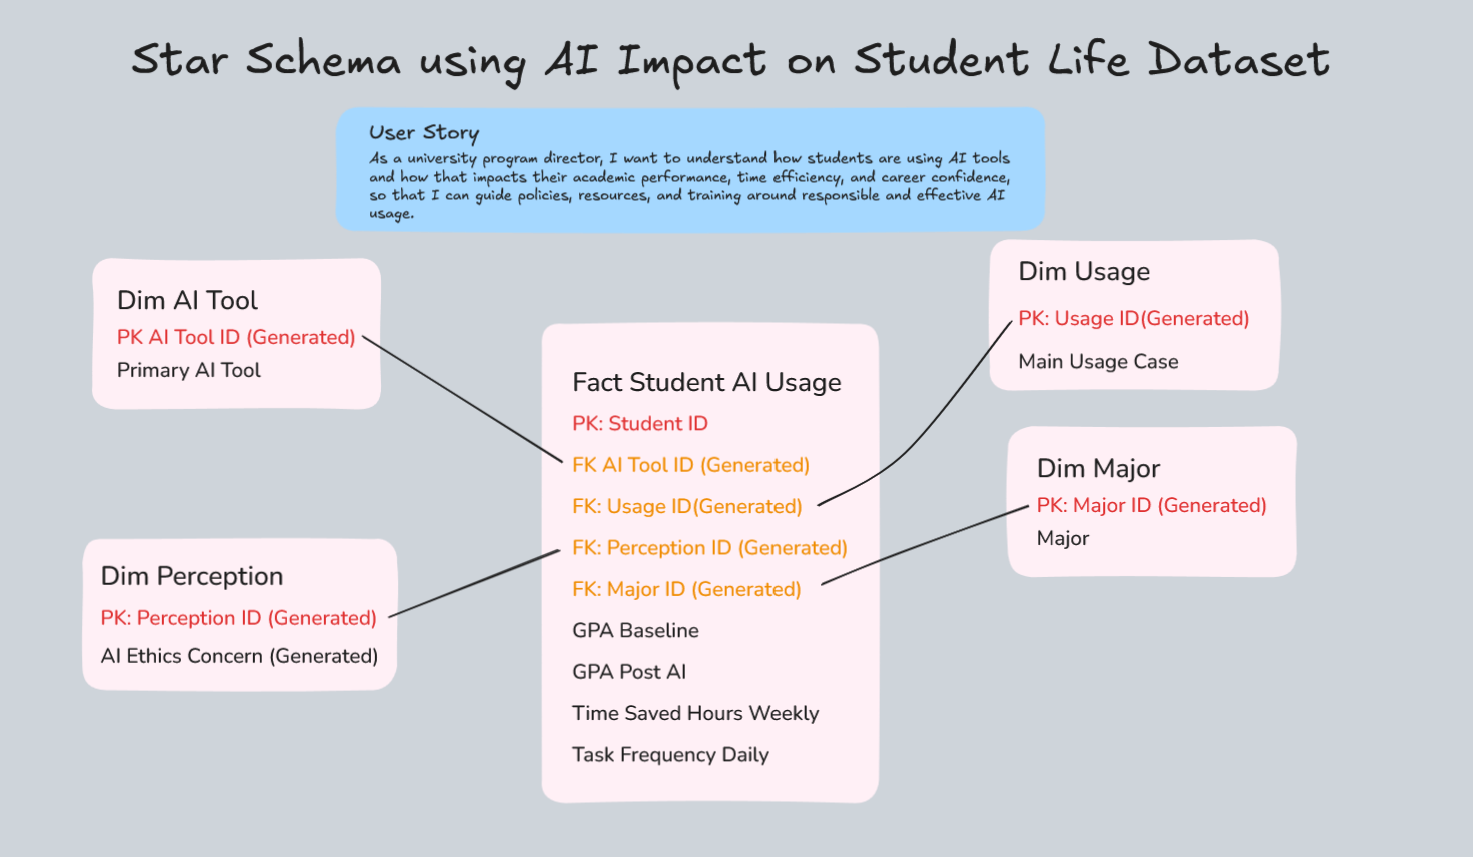
Fact Table: Fact_Student_AI_Usage
This is the center of everything, where the measurable data lives.
Granularity: One row per student (future: per student per semester)
Columns include:
- Student_ID
- AI_Tool_ID
- Usage_ID
- Perception_ID
- Major_ID
- GPA_Baseline
- GPA_Post_AI
- Time_Saved_Hours_Weekly
- Task_Frequency_Daily
This is where all the metrics sit.
Dimension Tables
These store descriptive attributes and help avoid duplication.
1. Dim_AI_Tool
- AI_Tool_ID (HASH key)
- Primary_AI_Tool (e.g., ChatGPT, Claude, Gemini)
2. Dim_Usage
- Usage_ID (HASH key)
- Main_Usage_Case (e.g., Essay Writing, Debugging)
3. Dim_Major
- Major_ID (HASH key)
- Major (e.g., Biology, Data Science)
4. Dim_Perception
- Perception_ID (HASH key)
- AI_Ethics_Concern (Low, Medium, High)
Each dimension table connects back to the fact table using IDs:
Dim_AI_Tool : AI_Tool_ID
Dim_Usage: Usage_ID
Dim_Major: Major_ID
Dim_Perception: Perception_ID
Thinking Ahead (Future State)
One thing I started thinking about (and would definitely implement next):
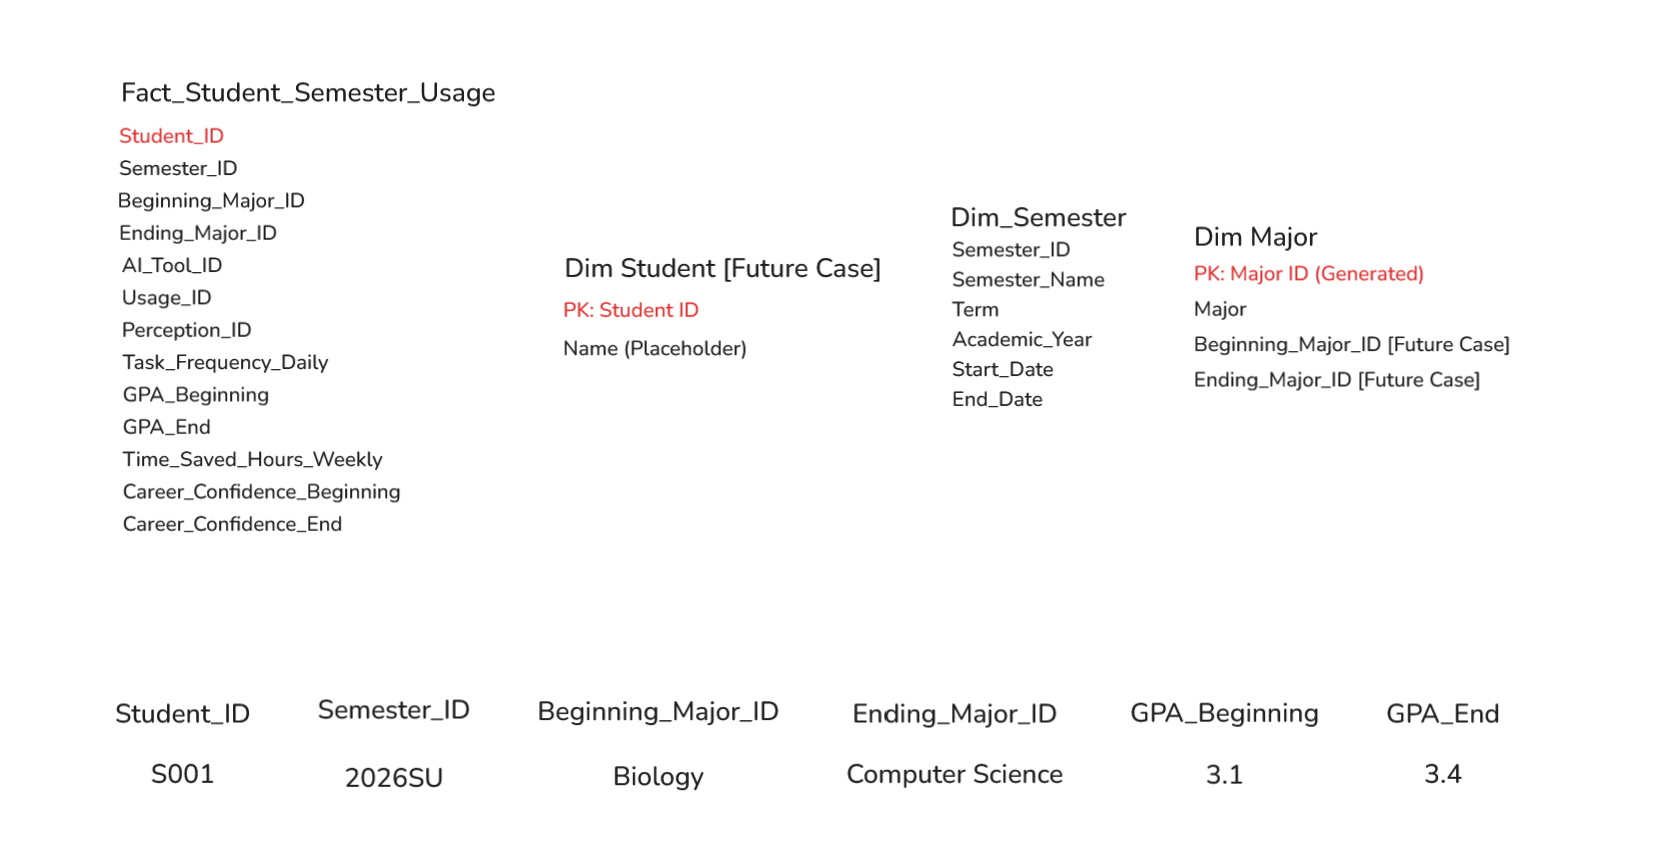
Tracking this data over time (semester-by-semester)
That would change the granularity to:
- Student + Semester
And allow analysis like:
- How GPA changes over time with AI usage
- Whether students switch majors
- How behavior evolves semester to semester
This is where adding a Date/Semester dimension becomes powerful.
Final Thoughts
The biggest takeaway for me:
Taking the time to:
- Create a proper user story
- Break data into dimensions
- Define a fact table
Making everything downstream (User Story, SQL, Tableau, dashboards) way easier and more meaningful.