


Using sports data to calculate rankings and standings is a common analytical challenge, but the techniques can be applied far beyond sport, from political elections to regional performance reporting and league tables.
For this exercise, I worked through Preppin' Data Challenge 2020 - Week 3, where the goal was to transform NBA match results (split across multiple monthly files covering games played from October to January) into conference standings for the Eastern and Western Conferences.

To try this challenge yourself visit (before my plan guide): https://preppindata.blogspot.com/2020/01/2020-week-3.html
In this blog, I'll walk through my approach, what I learned, and why I ultimately found Alteryx better suited to this particular challenge than Tableau Prep.
The Metrics We Need
To recreate the conference standings, we need to calculate:
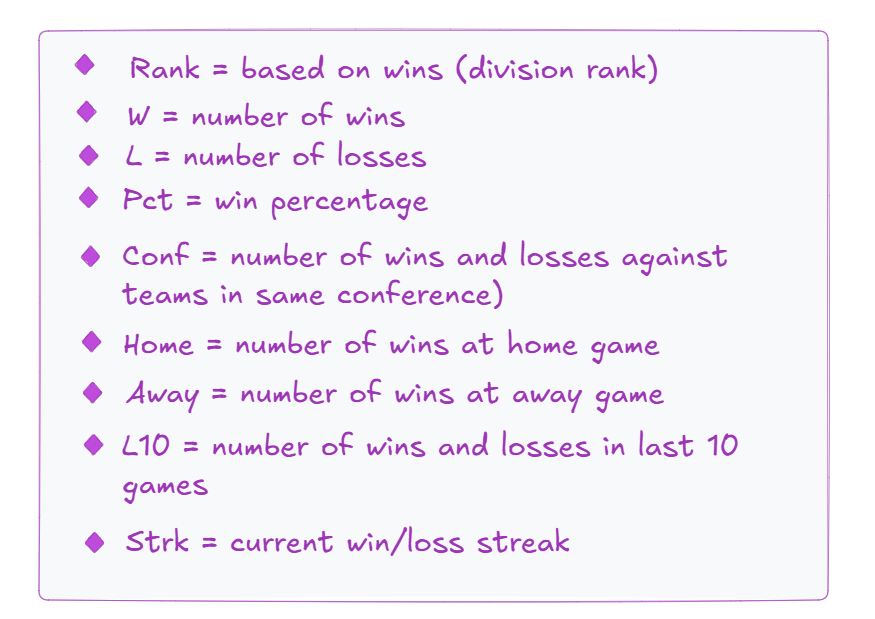
At first glance these metrics seem straightforward, but several require analysing matches sequentially and referencing previous games, making workflow design particularly important.
Planning the Workflow
Before building any calculations, I mapped out the logic required for each metric.
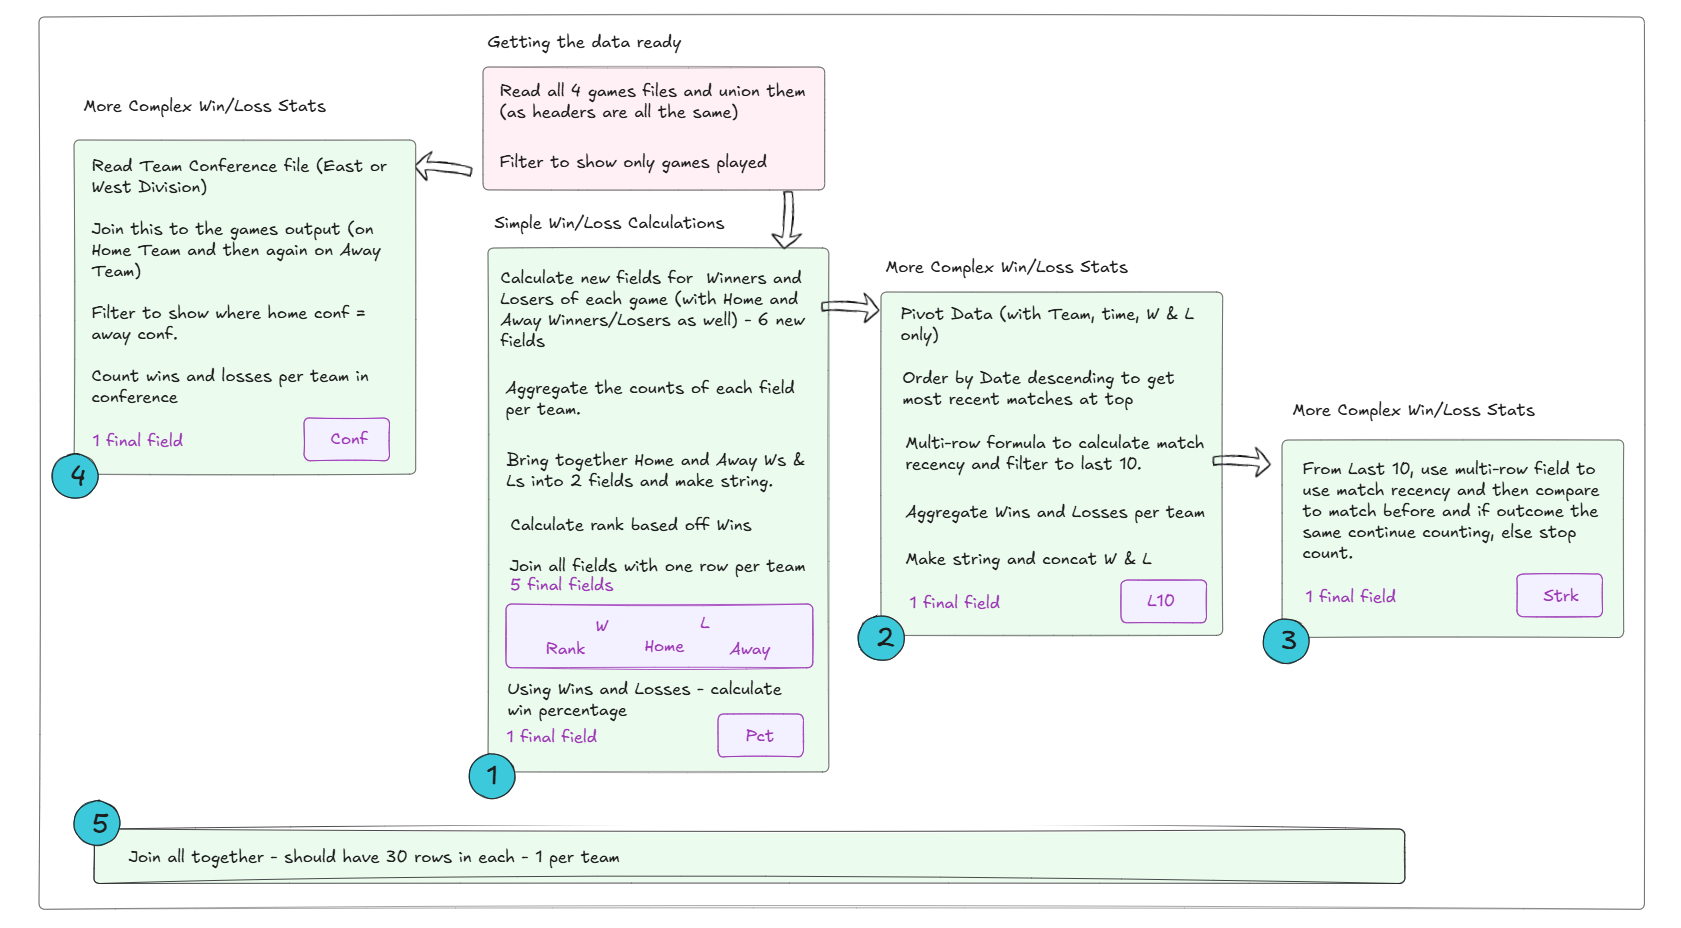
Rather than building one large workflow, I separated the calculations into logical containers, which made both development and debugging much easier):
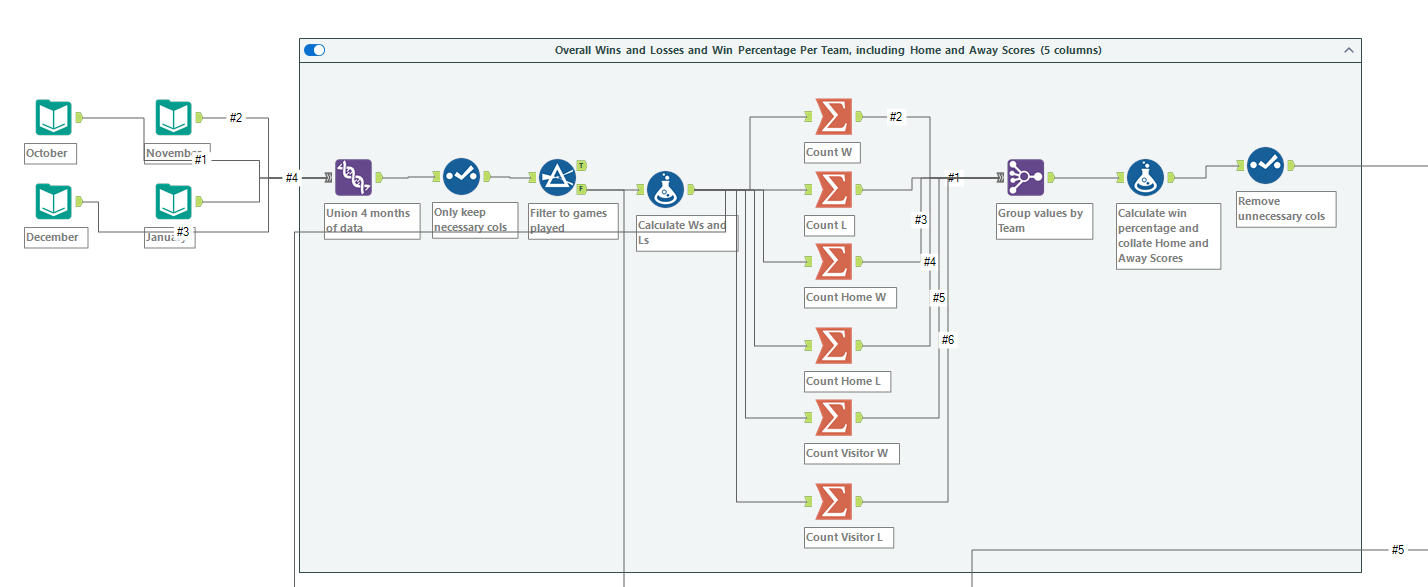
Section 1: Core Match Results
This section creates the foundational win/loss records for every team, alongside I calculated home and away performance metrics.
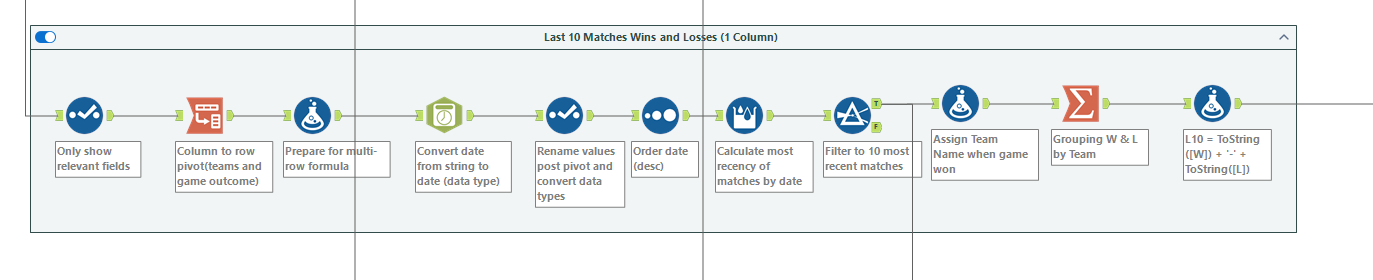
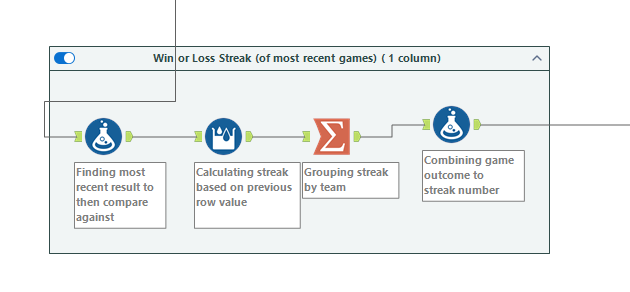
Section 2&3: Home and Away Records
This stage focuses on sequential calculations, including rolling records and current winning or losing streaks.
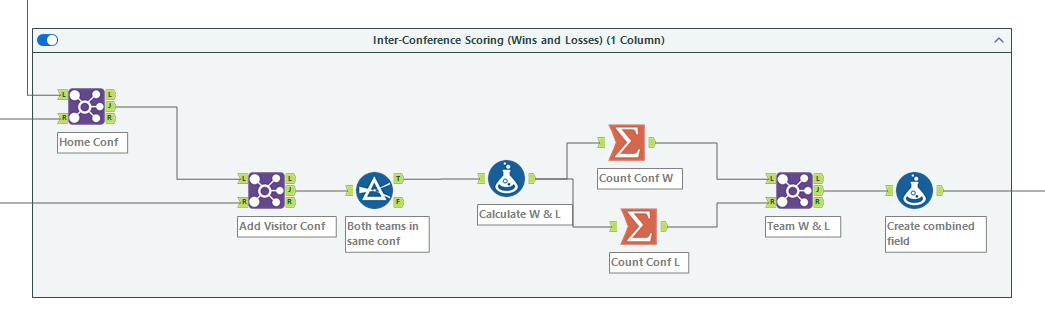
Section 4: Conference Records
Using the conference lookup file alongside the match data, I calculated records against teams within the same conference.
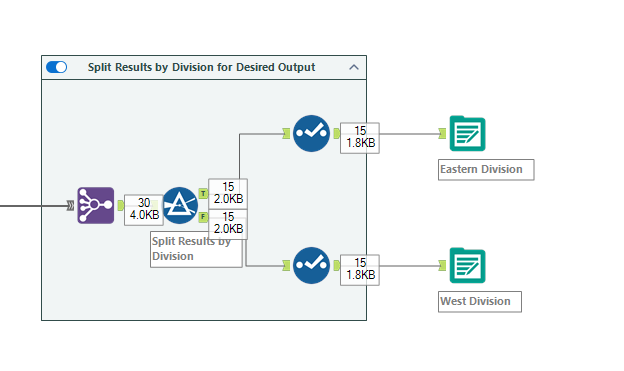
Finally, all calculated metrics were joined together to produce the completed standings table.
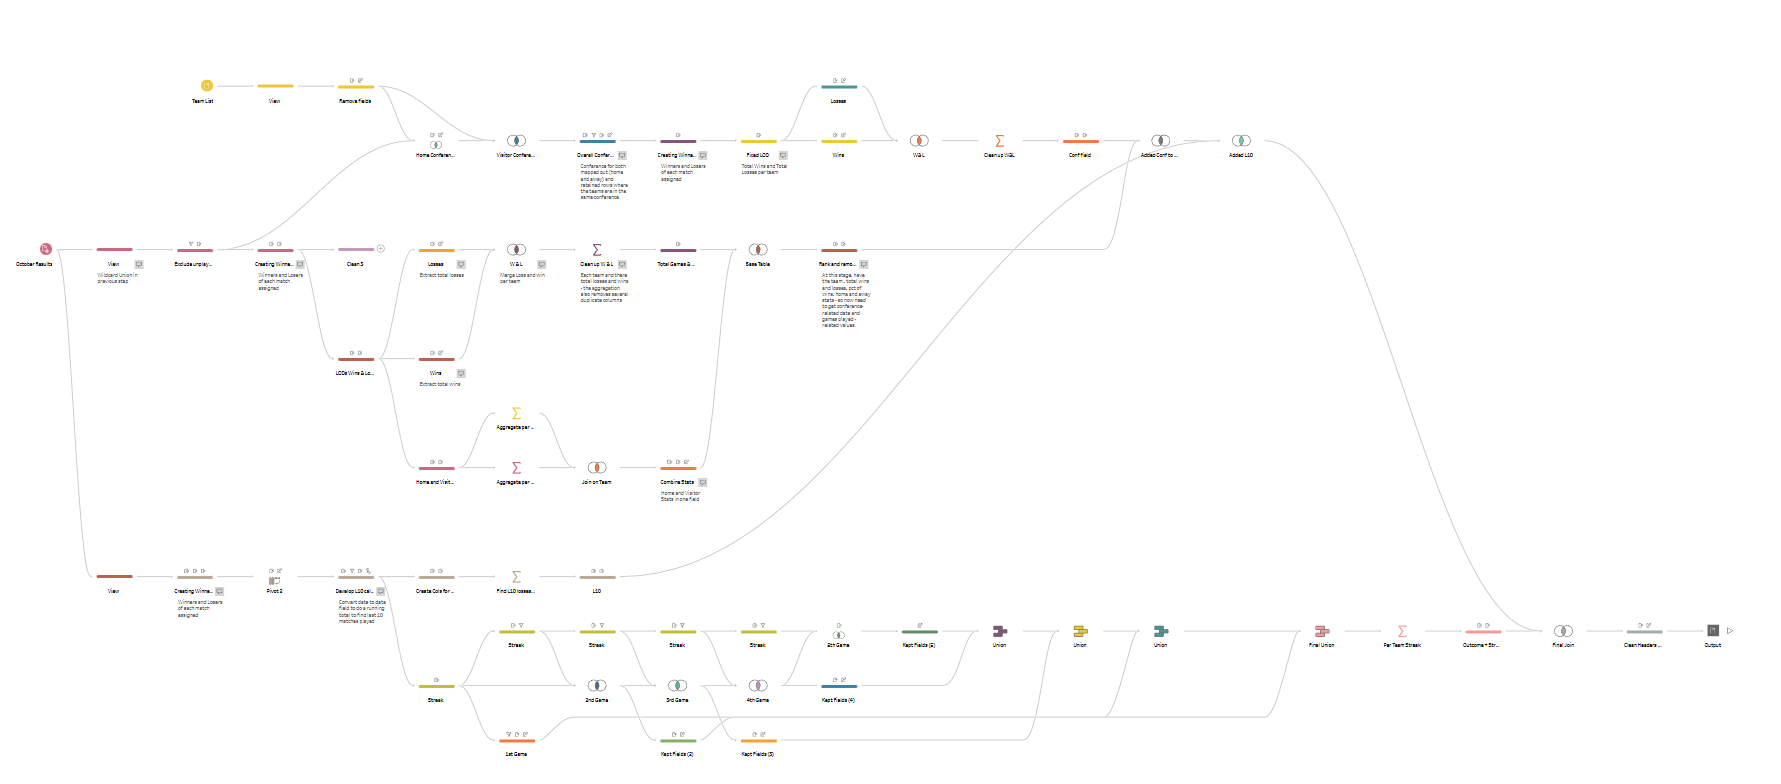
Comparing the Workflows
Below is a snapshot comparison of both approaches.
Alteryx
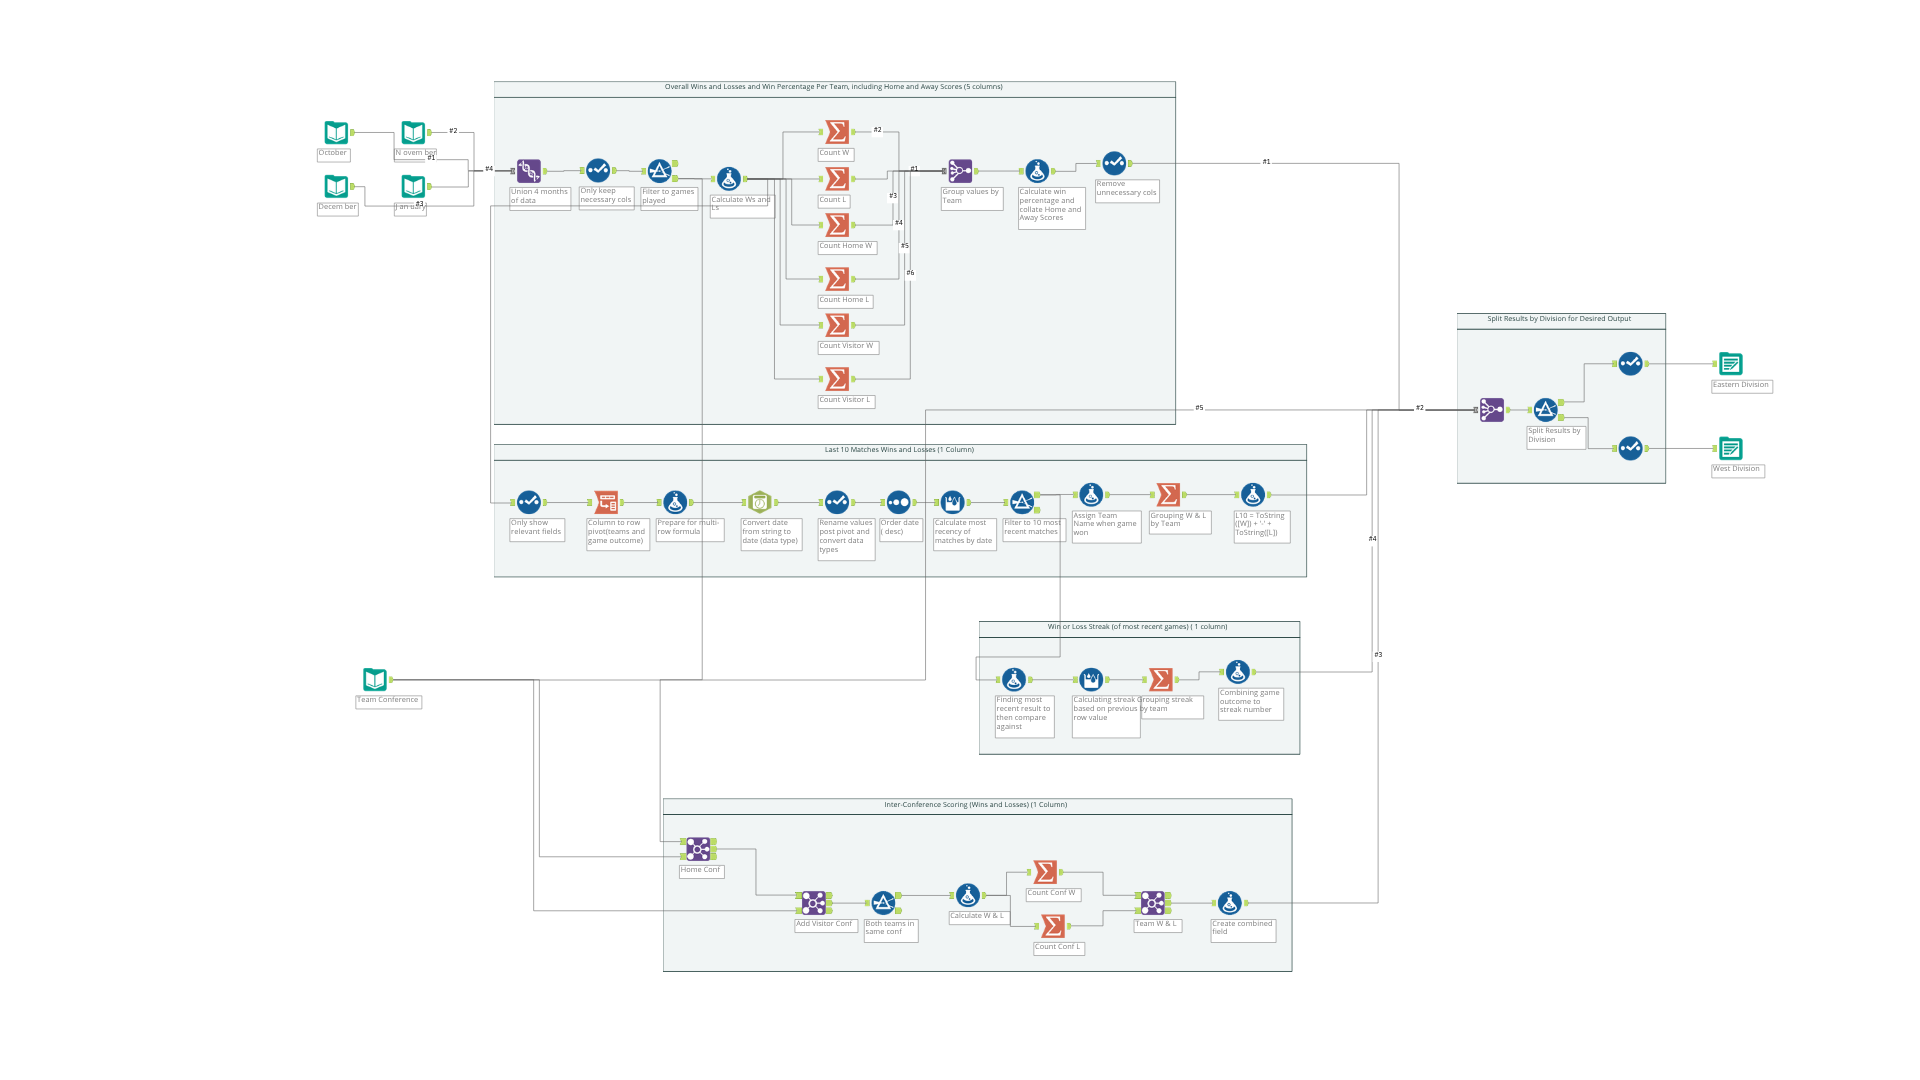
Tableau Prep
Why Alteryx Worked Better for This Challenge
Having completed the challenge in both Tableau Prep and Alteryx, the differences are major.
The biggest advantage in Alteryx was the Multi-Row Formula Tool. Sports data often requires comparing a record to the previous game, previous result, or previous streak. In Alteryx, referencing prior rows is straightforward and highly flexible.
Another advantage in Alteryx was the ability to compartmentalise the workflow into reusable and traceable sections. Containers made it easy to organise calculations and understand the purpose of each stage.
In Tableau Prep, achieving the same outcome required a more complicated series of steps. At the time, calculations could not easily reference previously calculated values in the same way, making streak calculations particularly challenging. This resulted in additional workarounds and a more convoluted workflow overall.
The filtering experience in Alteryx was also more transparent. Complex filter logic can be viewed and edited more easily using expressions and formulas. Likewise, the ability to create multiple calculated fields before executing the workflow made development significantly faster.
Another feature I appreciated was the ability to perform multiple joins efficiently at the end of the process, allowing all calculated metrics to be combined in one step.
While the Tableau Prep workflow was more complex, it wasn't without value. Working through the challenge in Prep first helped me better understand the data, uncover potential issues, and refine the business logic.
As a result, when I rebuilt the solution in Alteryx, I was able to create a cleaner and more efficient workflow because I already understood the challenges involved.
I look forward to trying more interesting data prep challenges, but perhaps trying it in SQL next...so stay tuned!