


This project uses spatial tools in Alteryx to identify areas in New York City with sparse fire hydrant coverage. The goal is to create a spatial output that highlights locations with potentially higher fire risk due to limited nearby water access, which can then be visualized in Tableau.
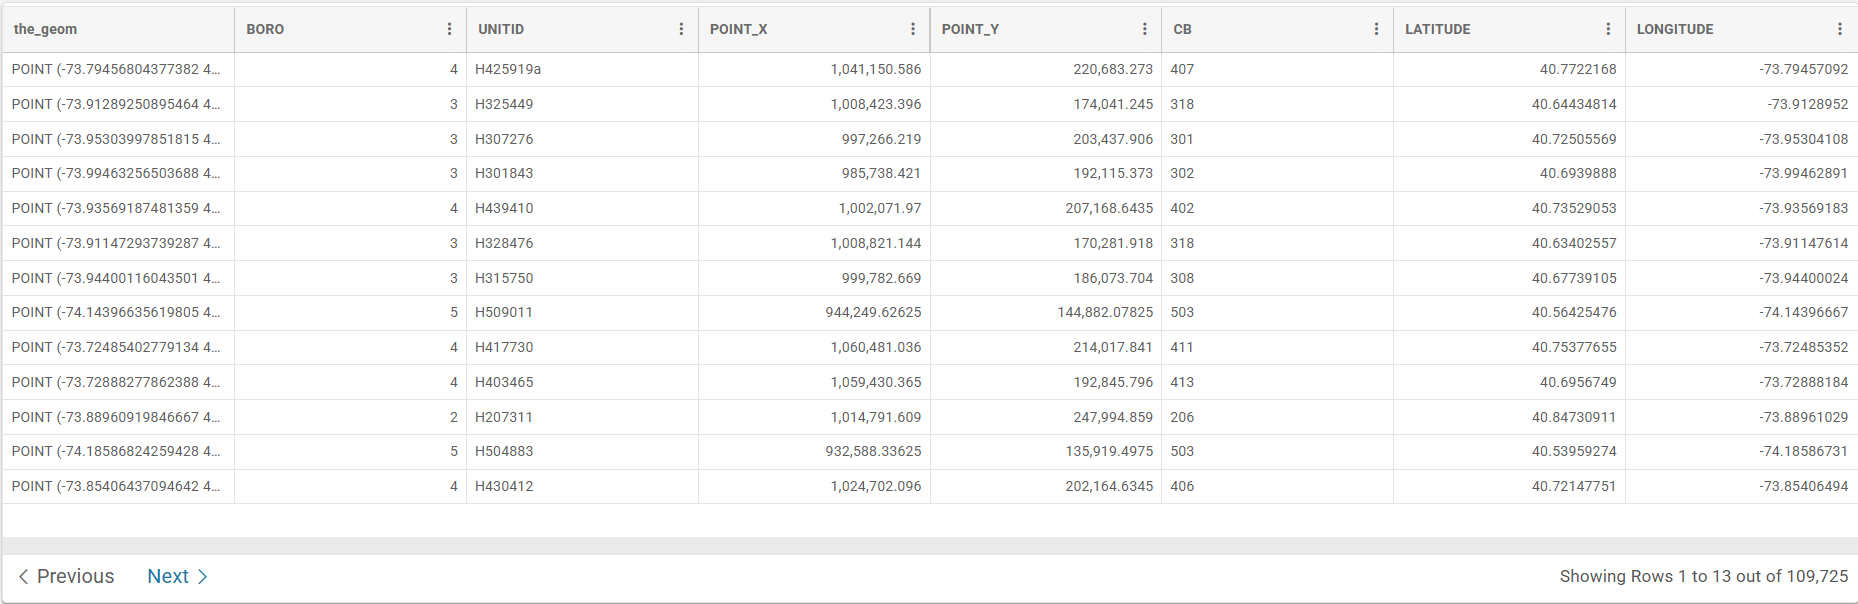
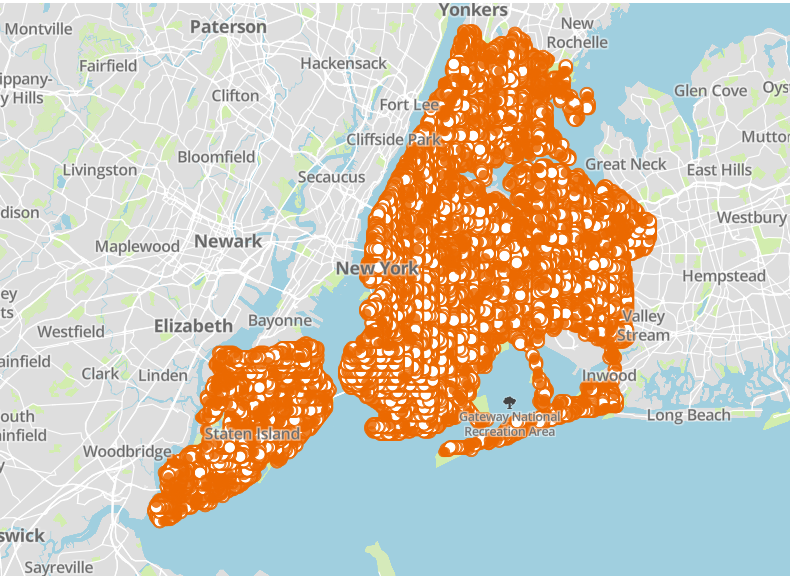
Why does this matter? The raw dataset for fire hydrant locations in NYC contains over 109K fire hydrant locations, and mapping every point in Tableau results in excessive marks that can slow performance and make analysis harder. More importantly, plotting hydrants only shows where they are, forcing users to visually infer where they are not.
Instead, this project transforms the data to directly highlight gaps in coverage—making the analysis more efficient, improving dashboard performance, and helping users quickly identify areas of potential risk without unnecessary effort.
Additionally, the analysis operates on each fire hydrant as a spatial point. Because firefighters can connect hoses to hydrants within a certain distance, each hydrant represents more than just a single location—it defines a surrounding service area. For this project, we model that coverage as a circular buffer (e.g., a 1000-foot radius) to represent a “safe zone” where water access is readily available during a fire.
This distance should be user-defined, allowing a fire planner or emergency response analyst to adjust the radius based on real-world hose reach and operational constraints. By doing so, the model becomes flexible and adaptable to different scenarios.
Since this approach relies heavily on spatial operations like buffering and spatial aggregation, Alteryx is a strong choice for building and executing the workflow efficiently.
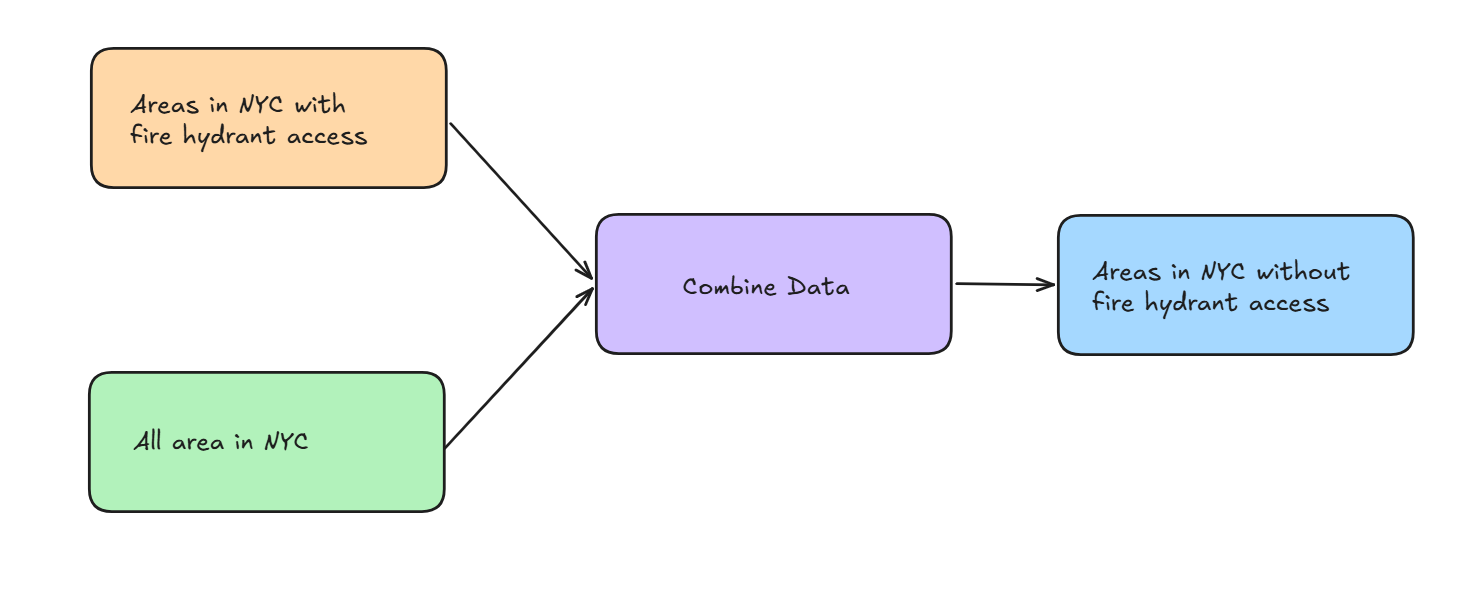
Here is a high level sketch of the approach to this project: first, we define areas of New York City that have fire hydrant access by creating coverage zones around each hydrant. Then, we subtract these covered areas from the total geographic area of the city. The result is a spatial layer that highlights regions without nearby fire hydrant access.
We’ll be working with two datasets. The first is a CSV file that contains the longitude and latitude of all fire hydrants in NYC. The second is a shapefile that represents the map of NYC.
Both datasets are available online and are provided by NYC Open Data and NYC.gov, which you can find here:
NYC Fire Hydrants: https://data.cityofnewyork.us/Environment/NYCDEP-Citywide-Hydrants/6pui-xhxz
NYC Borough Boundaries: https://www.nyc.gov/content/planning/pages/resources/datasets/borough-boundaries
Before diving into Alteryx, here’s a more detailed sketch of the workflow we’ll be building.
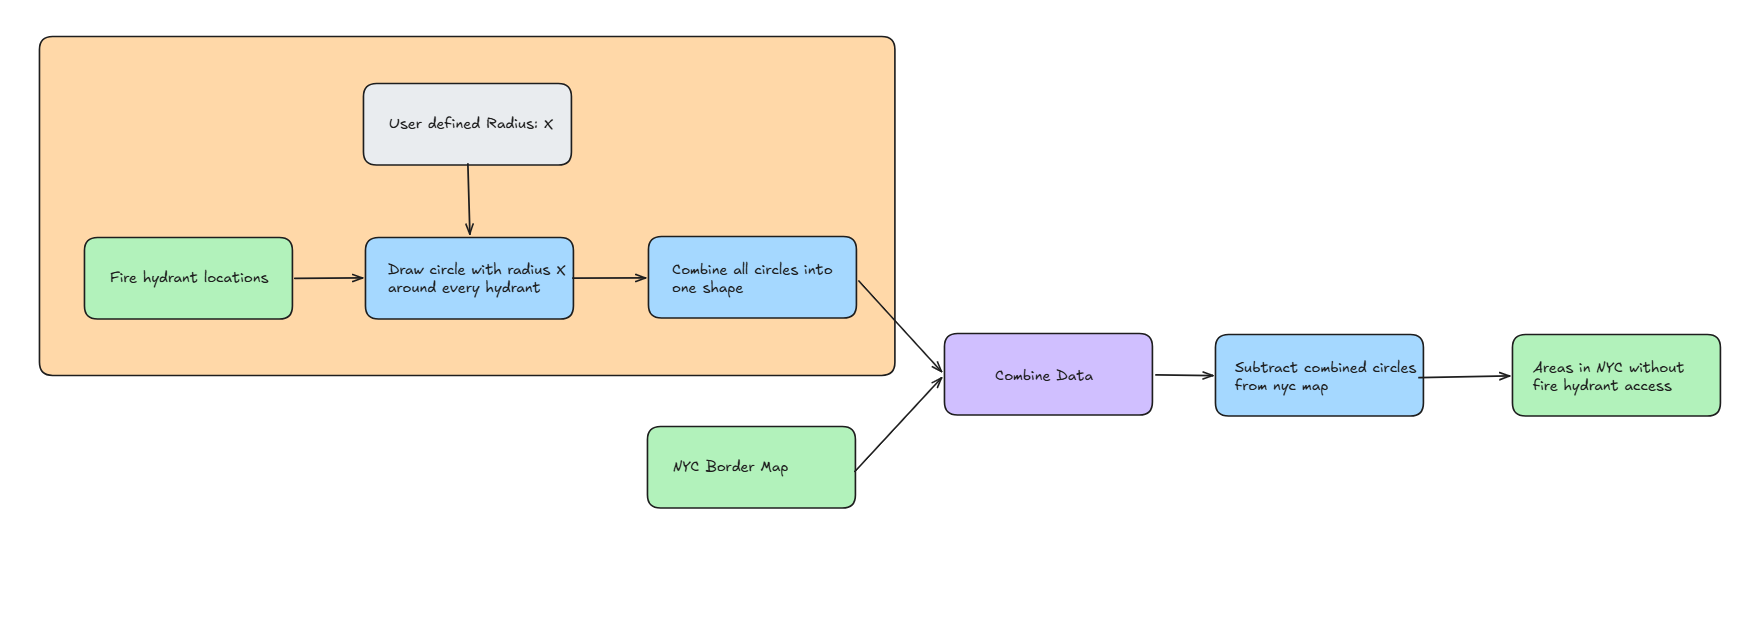
We start by taking the point locations of all fire hydrants and creating circular buffers around each one using a user-defined radius. These individual coverage areas are then merged into a single unified shape representing all regions with hydrant access. Next, we take the total geographic area of New York City and subtract this combined coverage area from it. The result is a spatial output that highlights areas without nearby fire hydrant access.
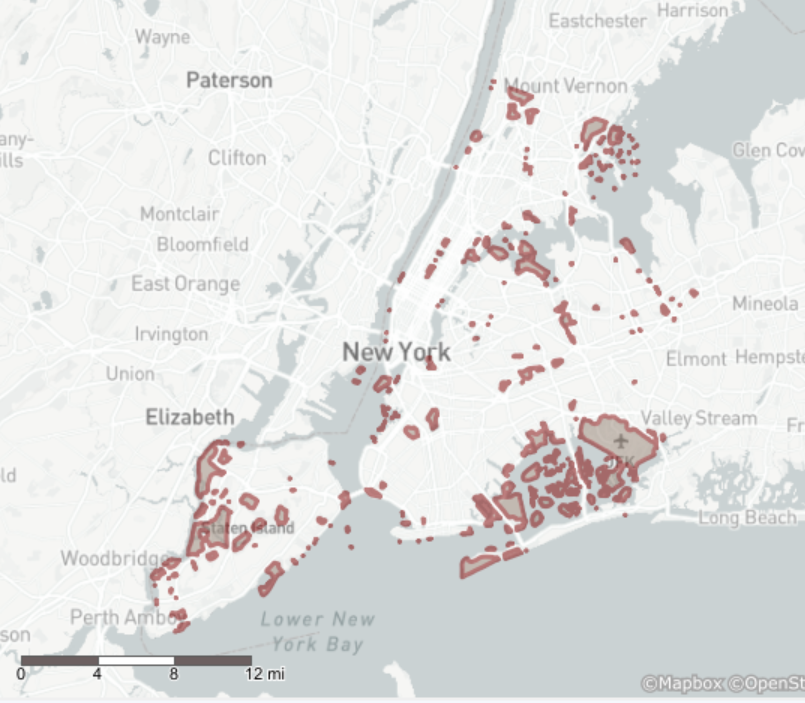
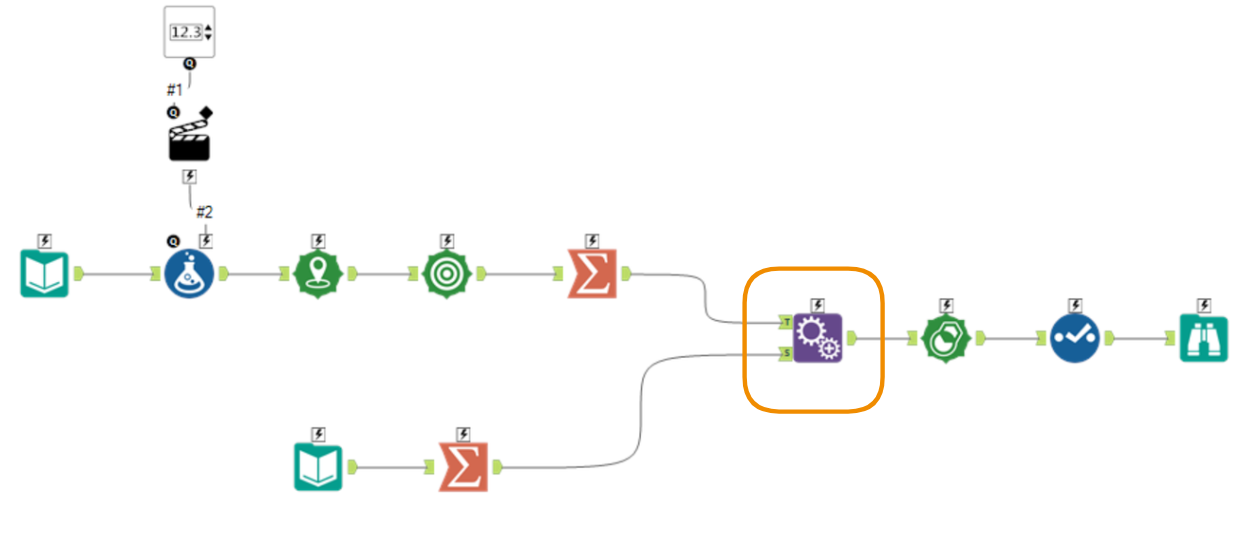
Now that we have a plan, let’s see how this workflow is implemented in Alteryx. Here is the final workflow and its output. It is showing areas in NYC that cannot be reached by connecting a 1000 feet (0.3 km) hose to a fire hydrant.
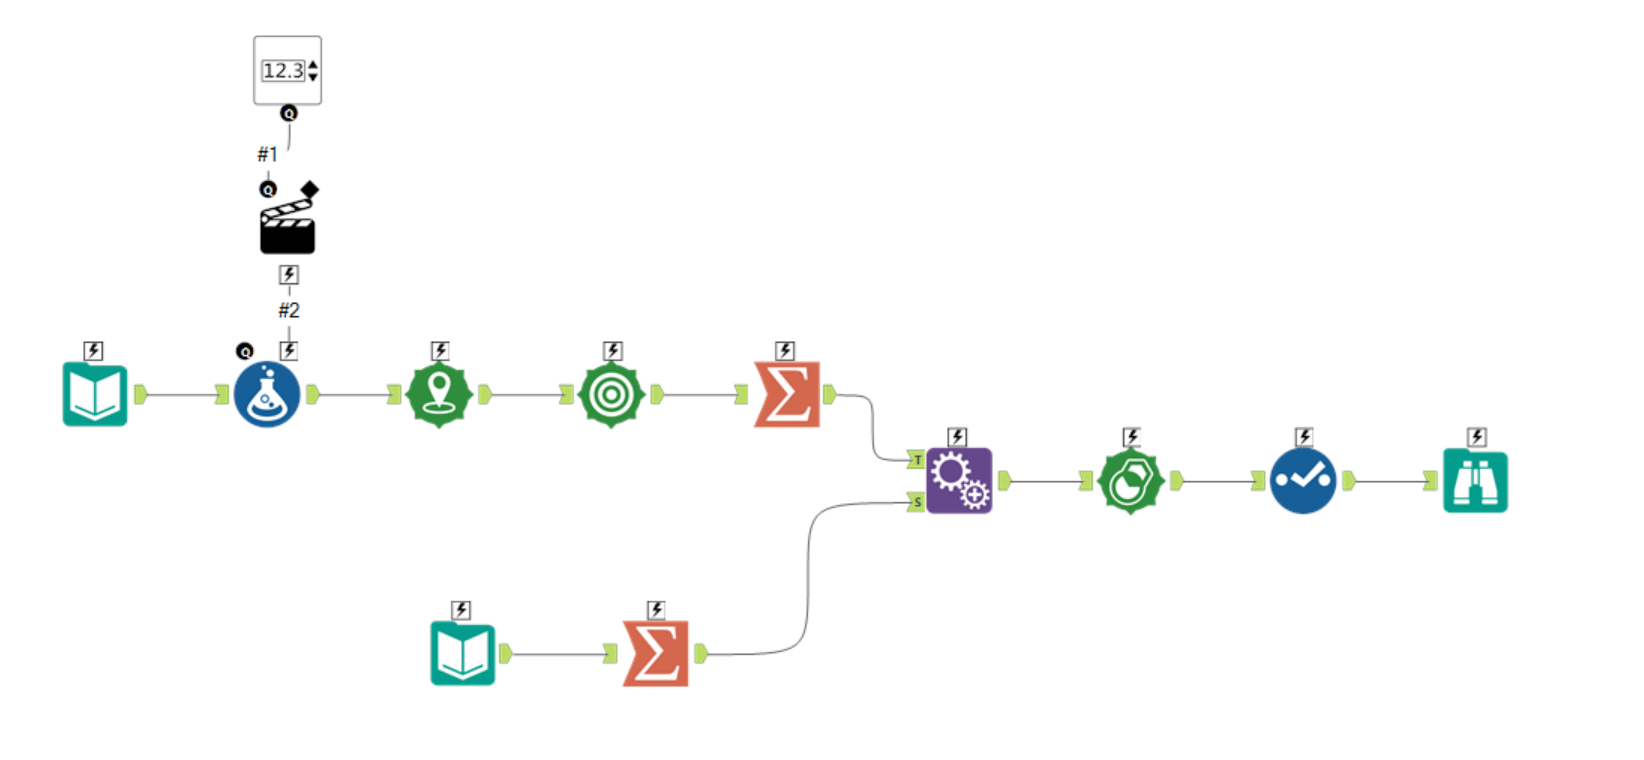
I’ll break down the flow into sections to explain the function of each component. For now, there is no output step included, but it can easily be added if we want to send the data into Tableau or another data visualization tool.
The first section of the flow (outlined below) identifies the areas of NYC that have access to fire hydrants.
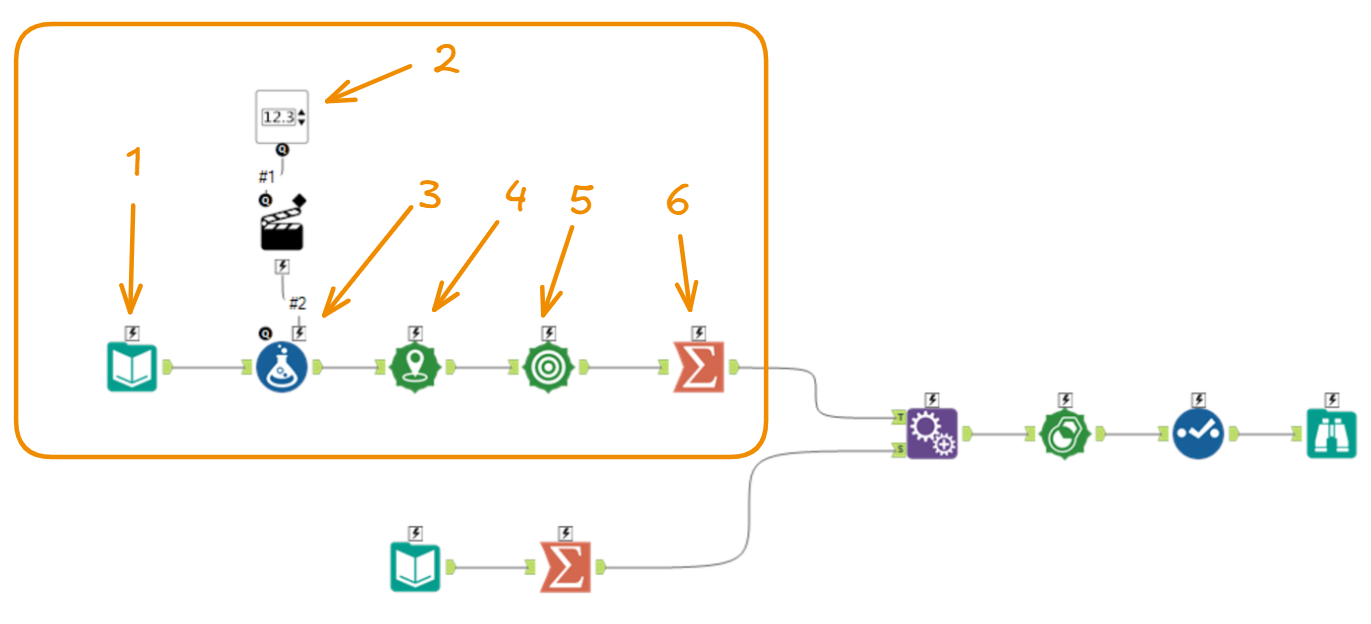
- Input data: Locations of all fire hydrants in NYC
- User input: Radius (in kilometers) to draw around each hydrant
- Put the user-defined radius into a new column
- Convert each fire hydrant’s longitude and latitude into a spatial point
- Draw a circle around each hydrant point using the radius from the new column
- Combine all circles from step 5 into a single unified shape
After this step, the second section of the flow prepares a spatial object representing all of NYC.
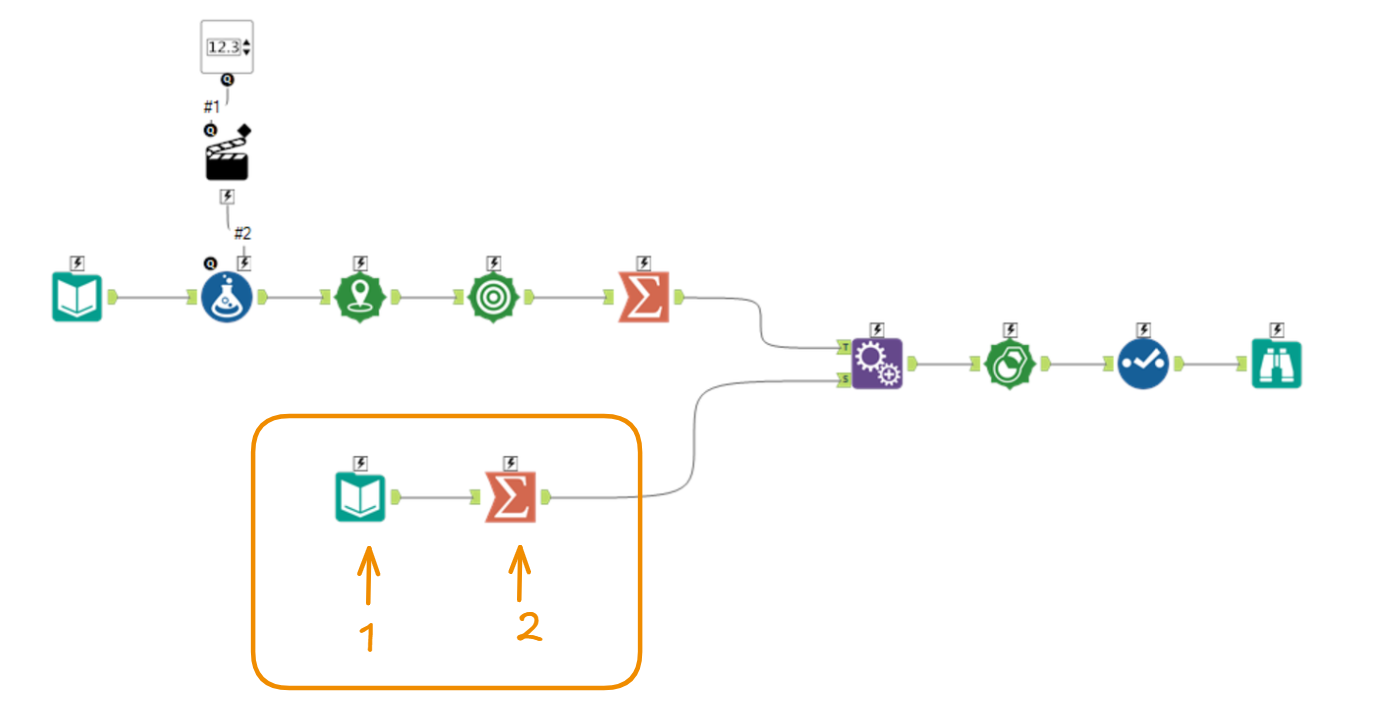
- Input data: Spatial file of NYC borough boundaries
- Combine all borough areas into a single unified shape
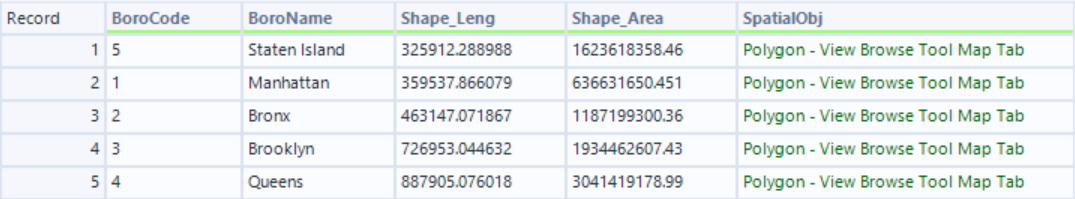
We had to do this because the input data splits the total area of NYC by borough, so it is first aggregated into a single unified area representing the entire city.
When this is complete, the two shapes can be appended so they can be analyzed side by side, enabling row-level calculations.
The final steps perform row-level subtraction to identify the areas that do not have fire hydrant access within the user-defined distance.
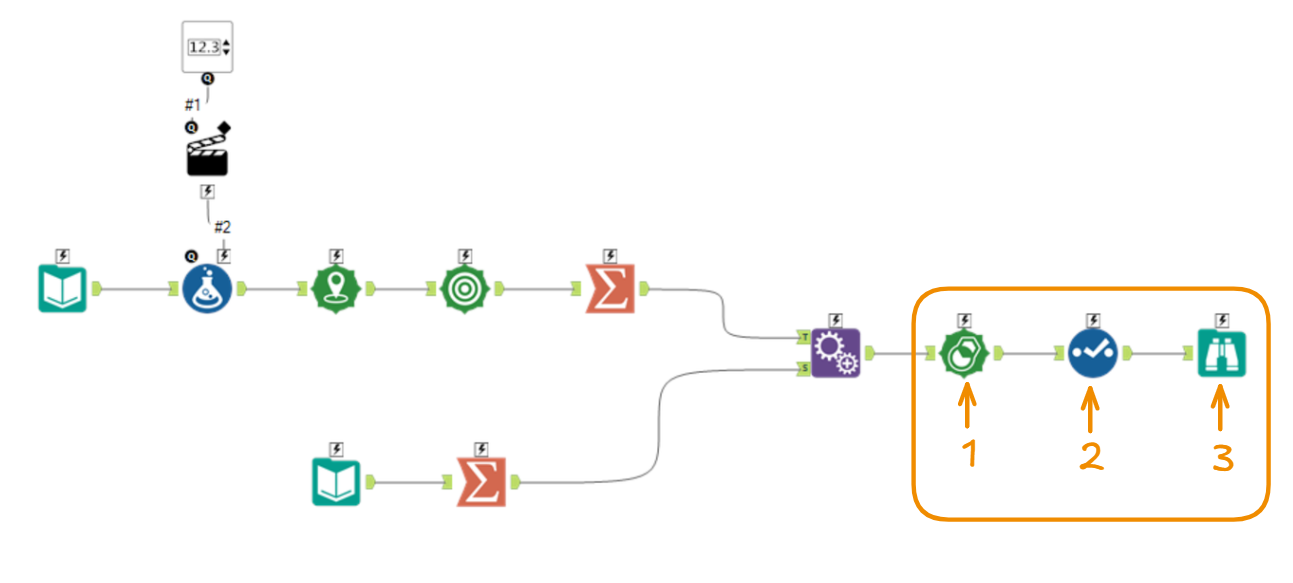
- Subtract the areas reachable by fire hydrants from the total area of NYC
- Remove unnecessary columns from the output
- Use the browse tool to view the final spatial file (areas without fire hydrant access)
This flow produces the output shown earlier, identifying areas in NYC that are not within access range of a fire hydrant based on a specified distance (e.g., 1000 feet). Because it incorporates a user-defined input, it can be easily adjusted—for example, if a user assumes that fire trucks can only connect to hydrants within 500 feet, the output will update accordingly.
More importantly, it precomputes the unreachable areas, which are computationally expensive to derive directly in data visualization tools, so this workload is shifted into the data preparation stage. This ensures better performance and responsiveness in downstream tools.
With this flow, we can explicitly show users where fire hydrant coverage is missing, rather than relying on the raw data approach of showing only hydrant locations and requiring users to infer the gaps themselves.