This hack is a method you can use to change how the charts are displayed when someone clicks on them. (This walkthrough uses data from Sample Superstore)
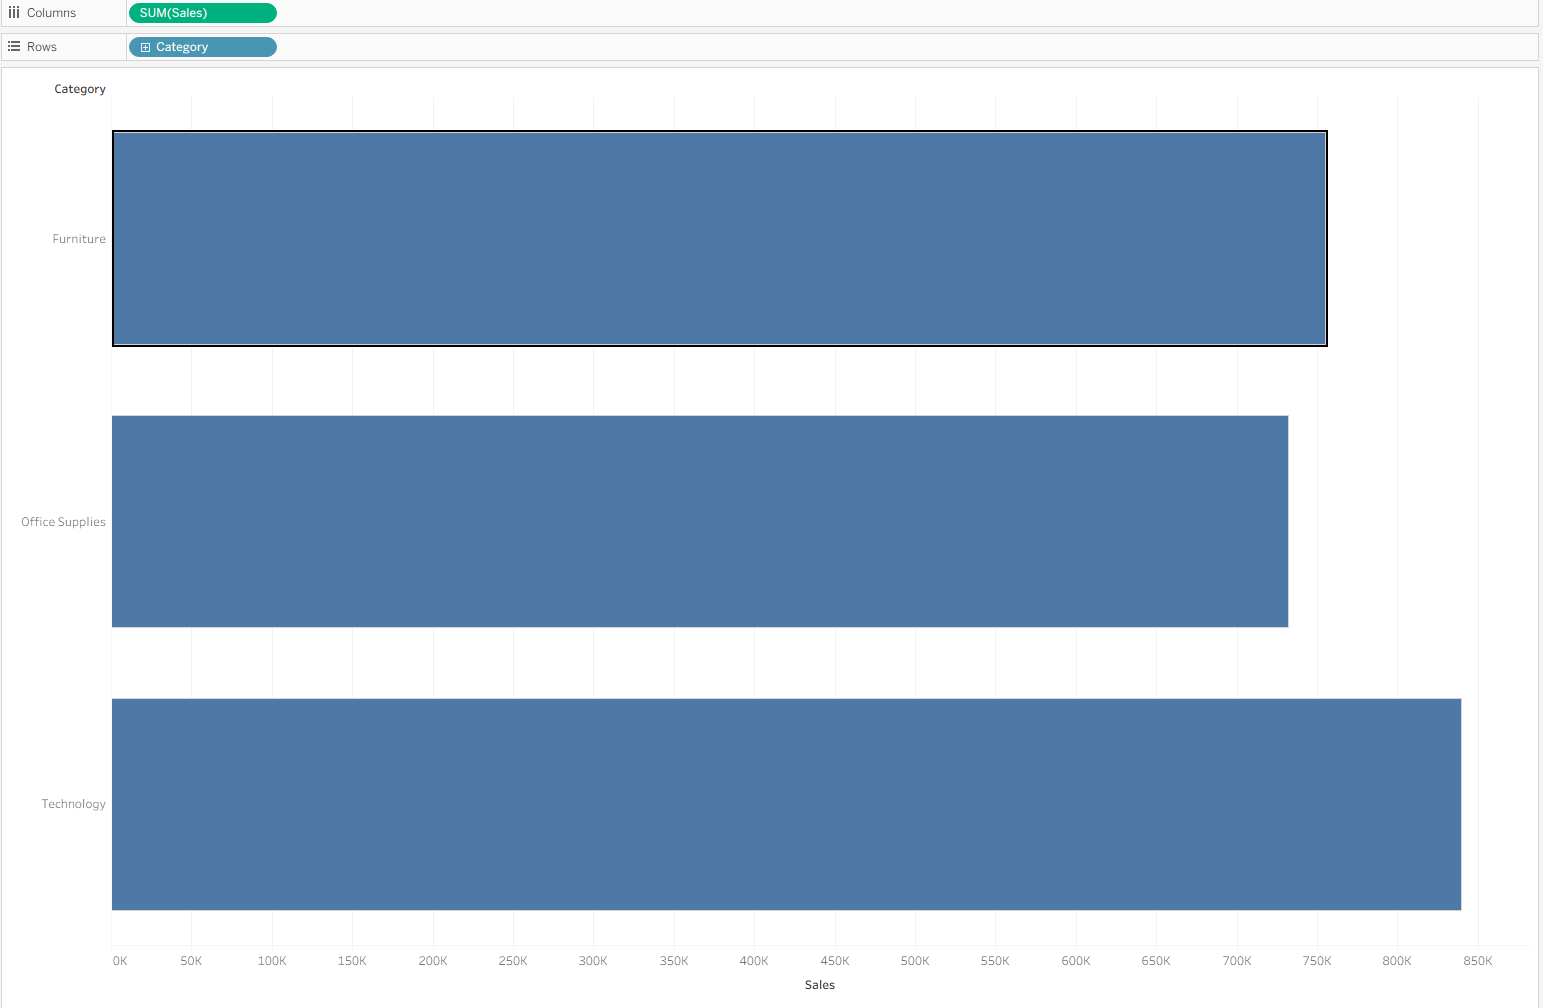
When you build a chart like below (Sales by Category), the user can click on a bar and get a highlight.
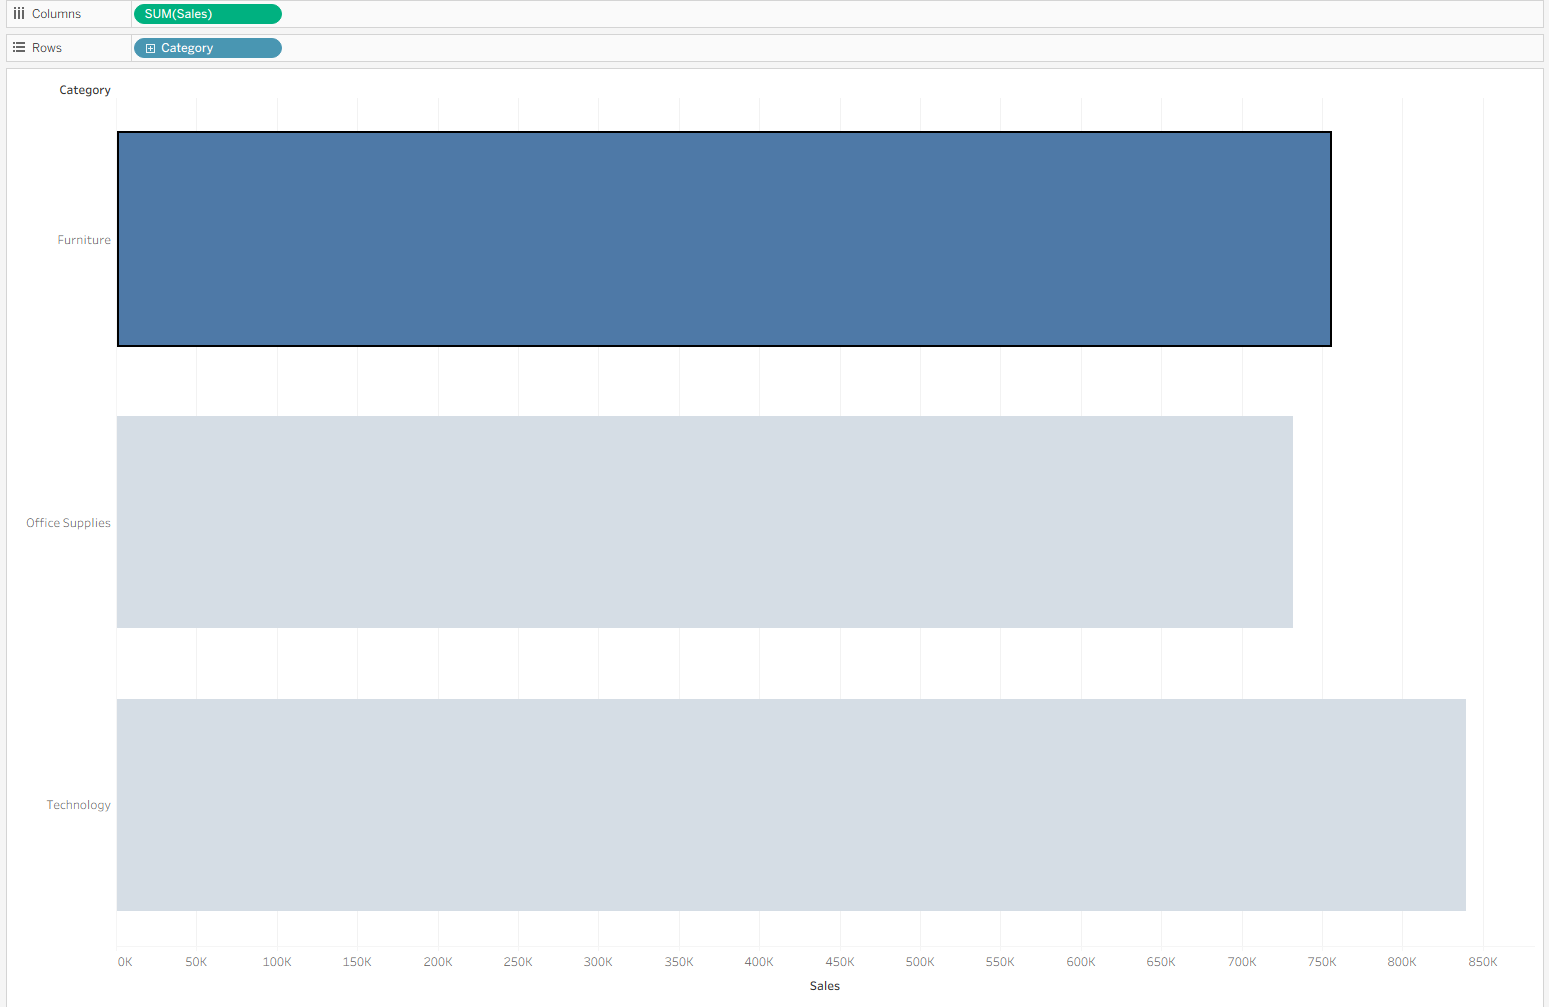
This simultaneously grays out the other bars, which sometimes you don't want to happen. This tutorial is a way to make sure that they are not grayed out.
All you need for this is to:
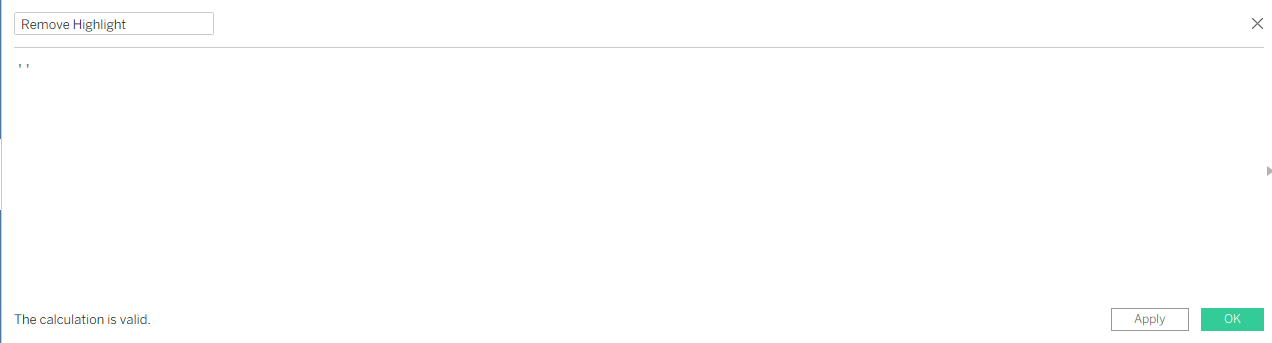
Step 1. make a calculated field of an empty string:
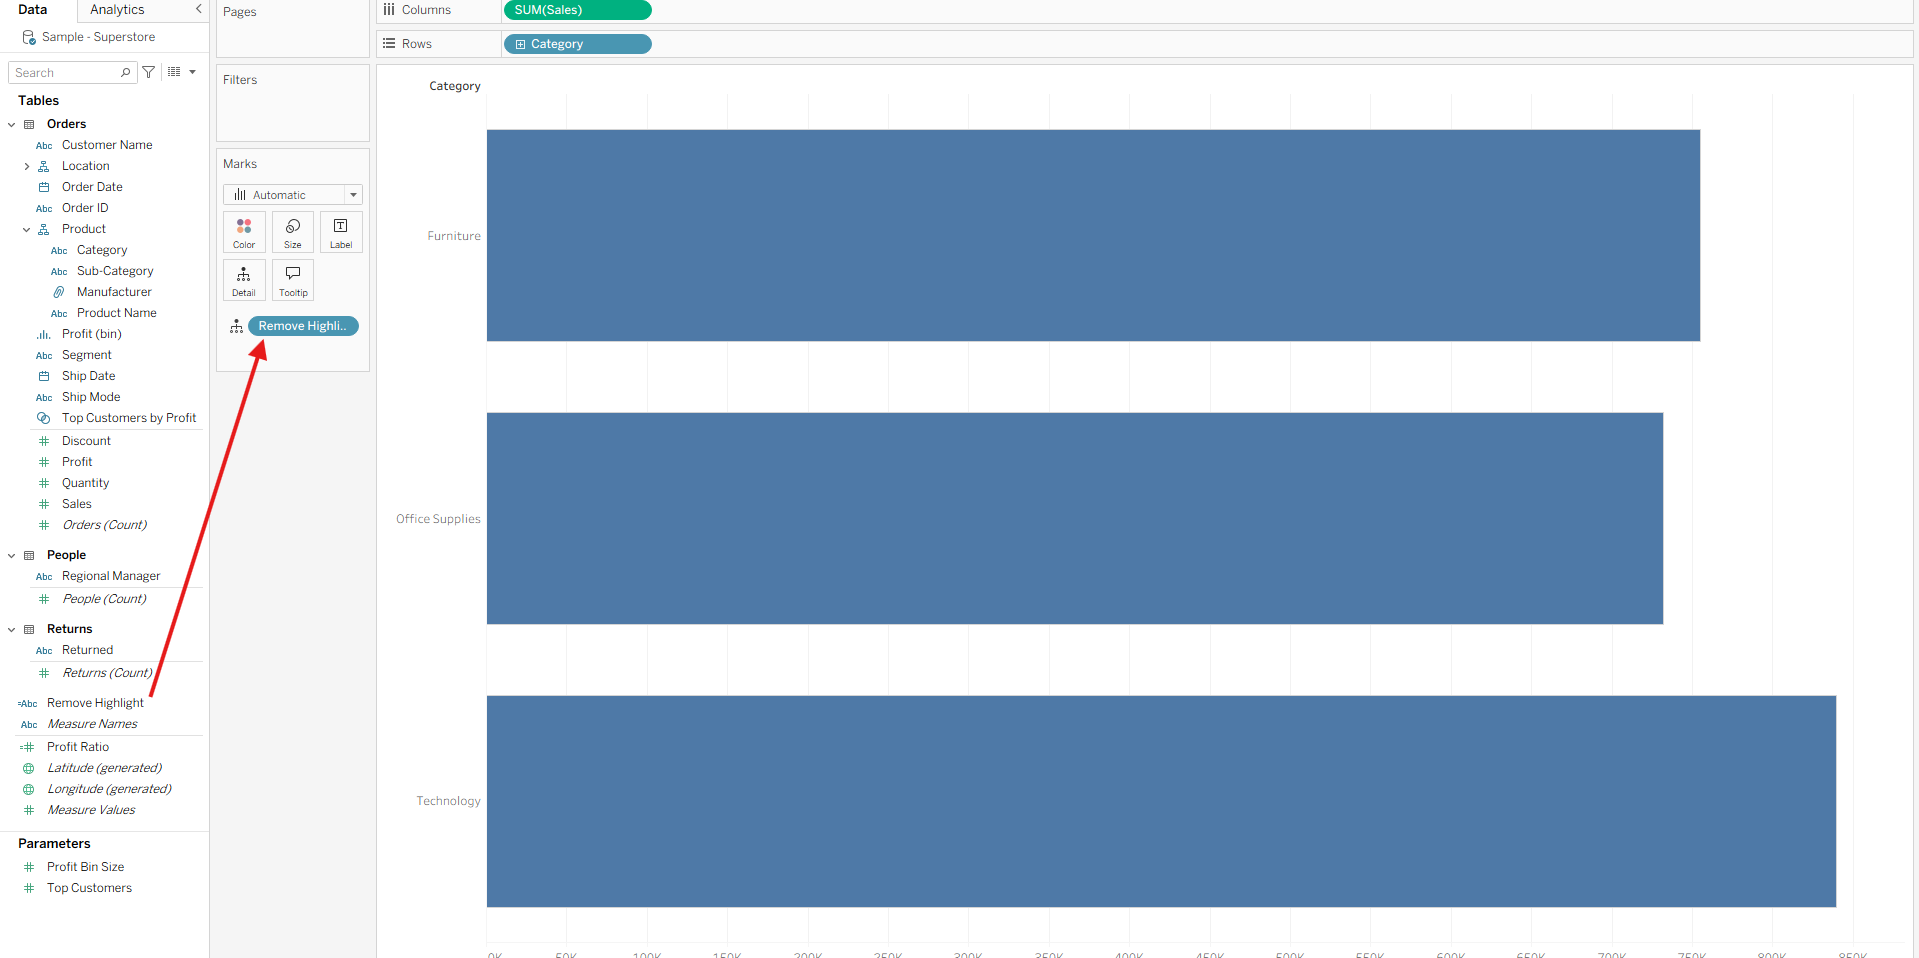
Step 2. Drag that onto details:
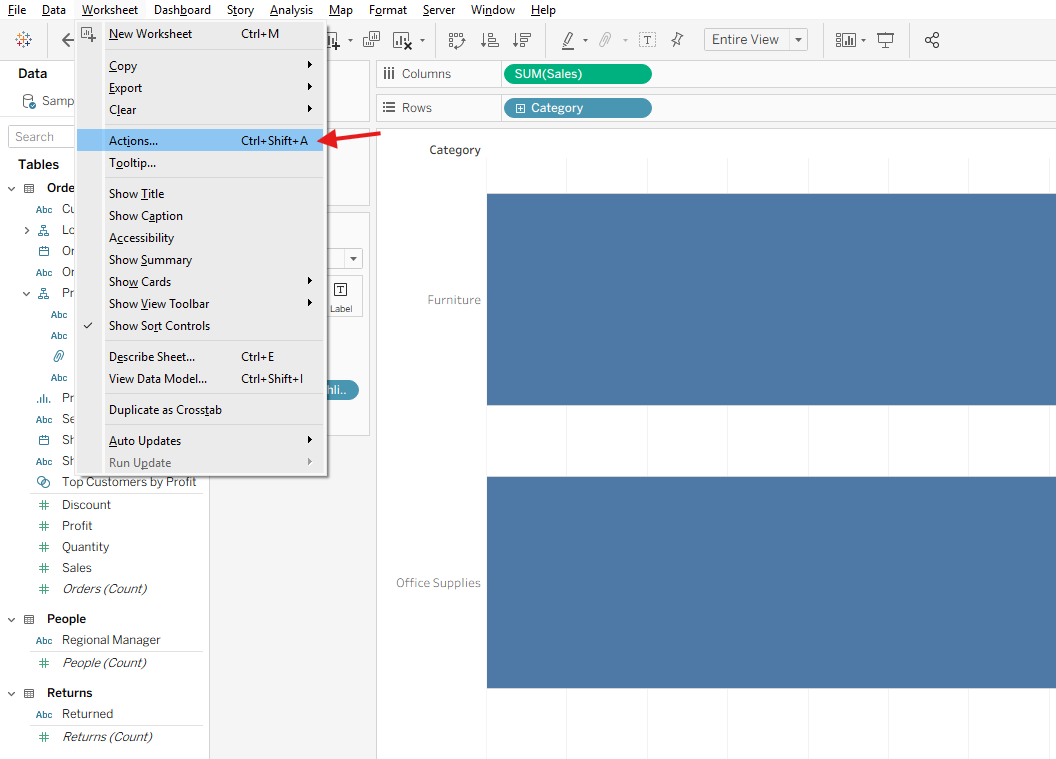
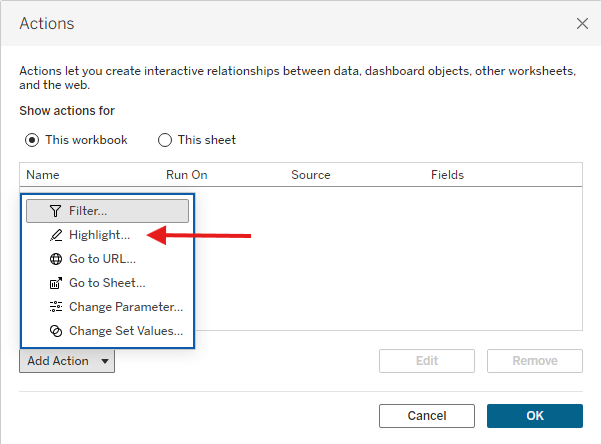
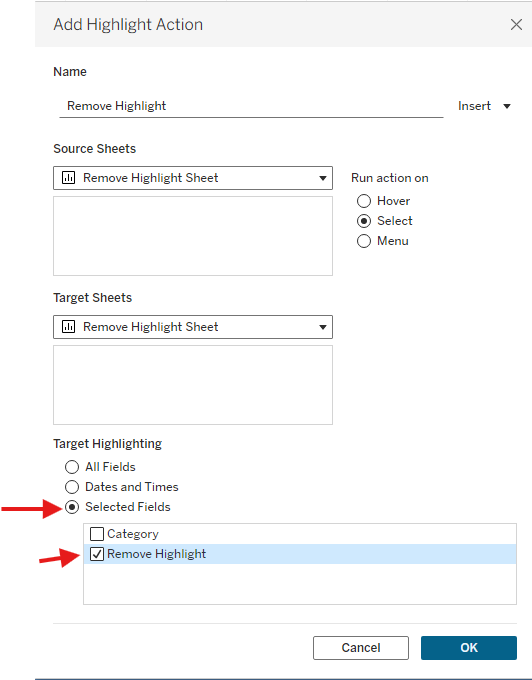
Step 3. Set up a highlight action
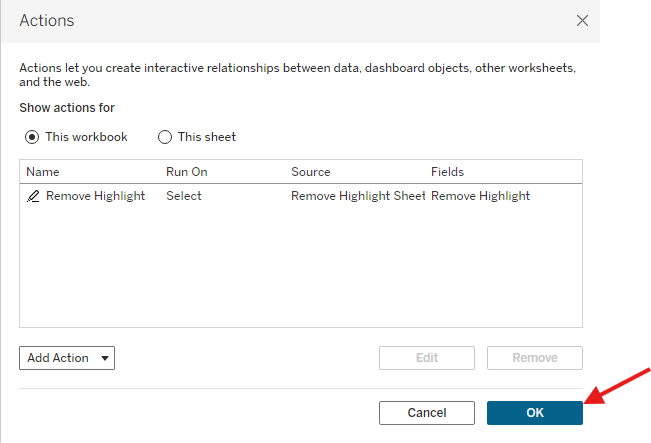
And that's it!
Try clicking on the bar now and you will notice that the other bars are not grayed out!