In my opinion, LODs are one of the most important concepts I've learned during my first 2 months at the Data School. A Level of Detail Expression (or LOD) is a special type of calculated field that enables us to manipulate our data's granularity, adding further depth to our analysis.
There are three main types of LOD Expressions: Fixed, Include and Exclude.
- Fixed LODs are the most common type. They allow you to specify a dimension or set of dimensions against which the calculation is performed, regardless of the dimensions present in the visualization.
- Include LOD: Include LOD expressions allow you to specify dimensions to include in the calculation, while the remaining dimensions are aggregated as usual. It allows you to focus on specific dimensions of interest and perform calculations based on their values while still considering other dimensions in the view.
- Exclude LOD: Exclude LOD expressions are the opposite of Include LOD expressions. They allow you to exclude specific dimensions from the calculation, enabling you to concentrate on a subset of dimensions while disregarding others.
How do I use a LOD?
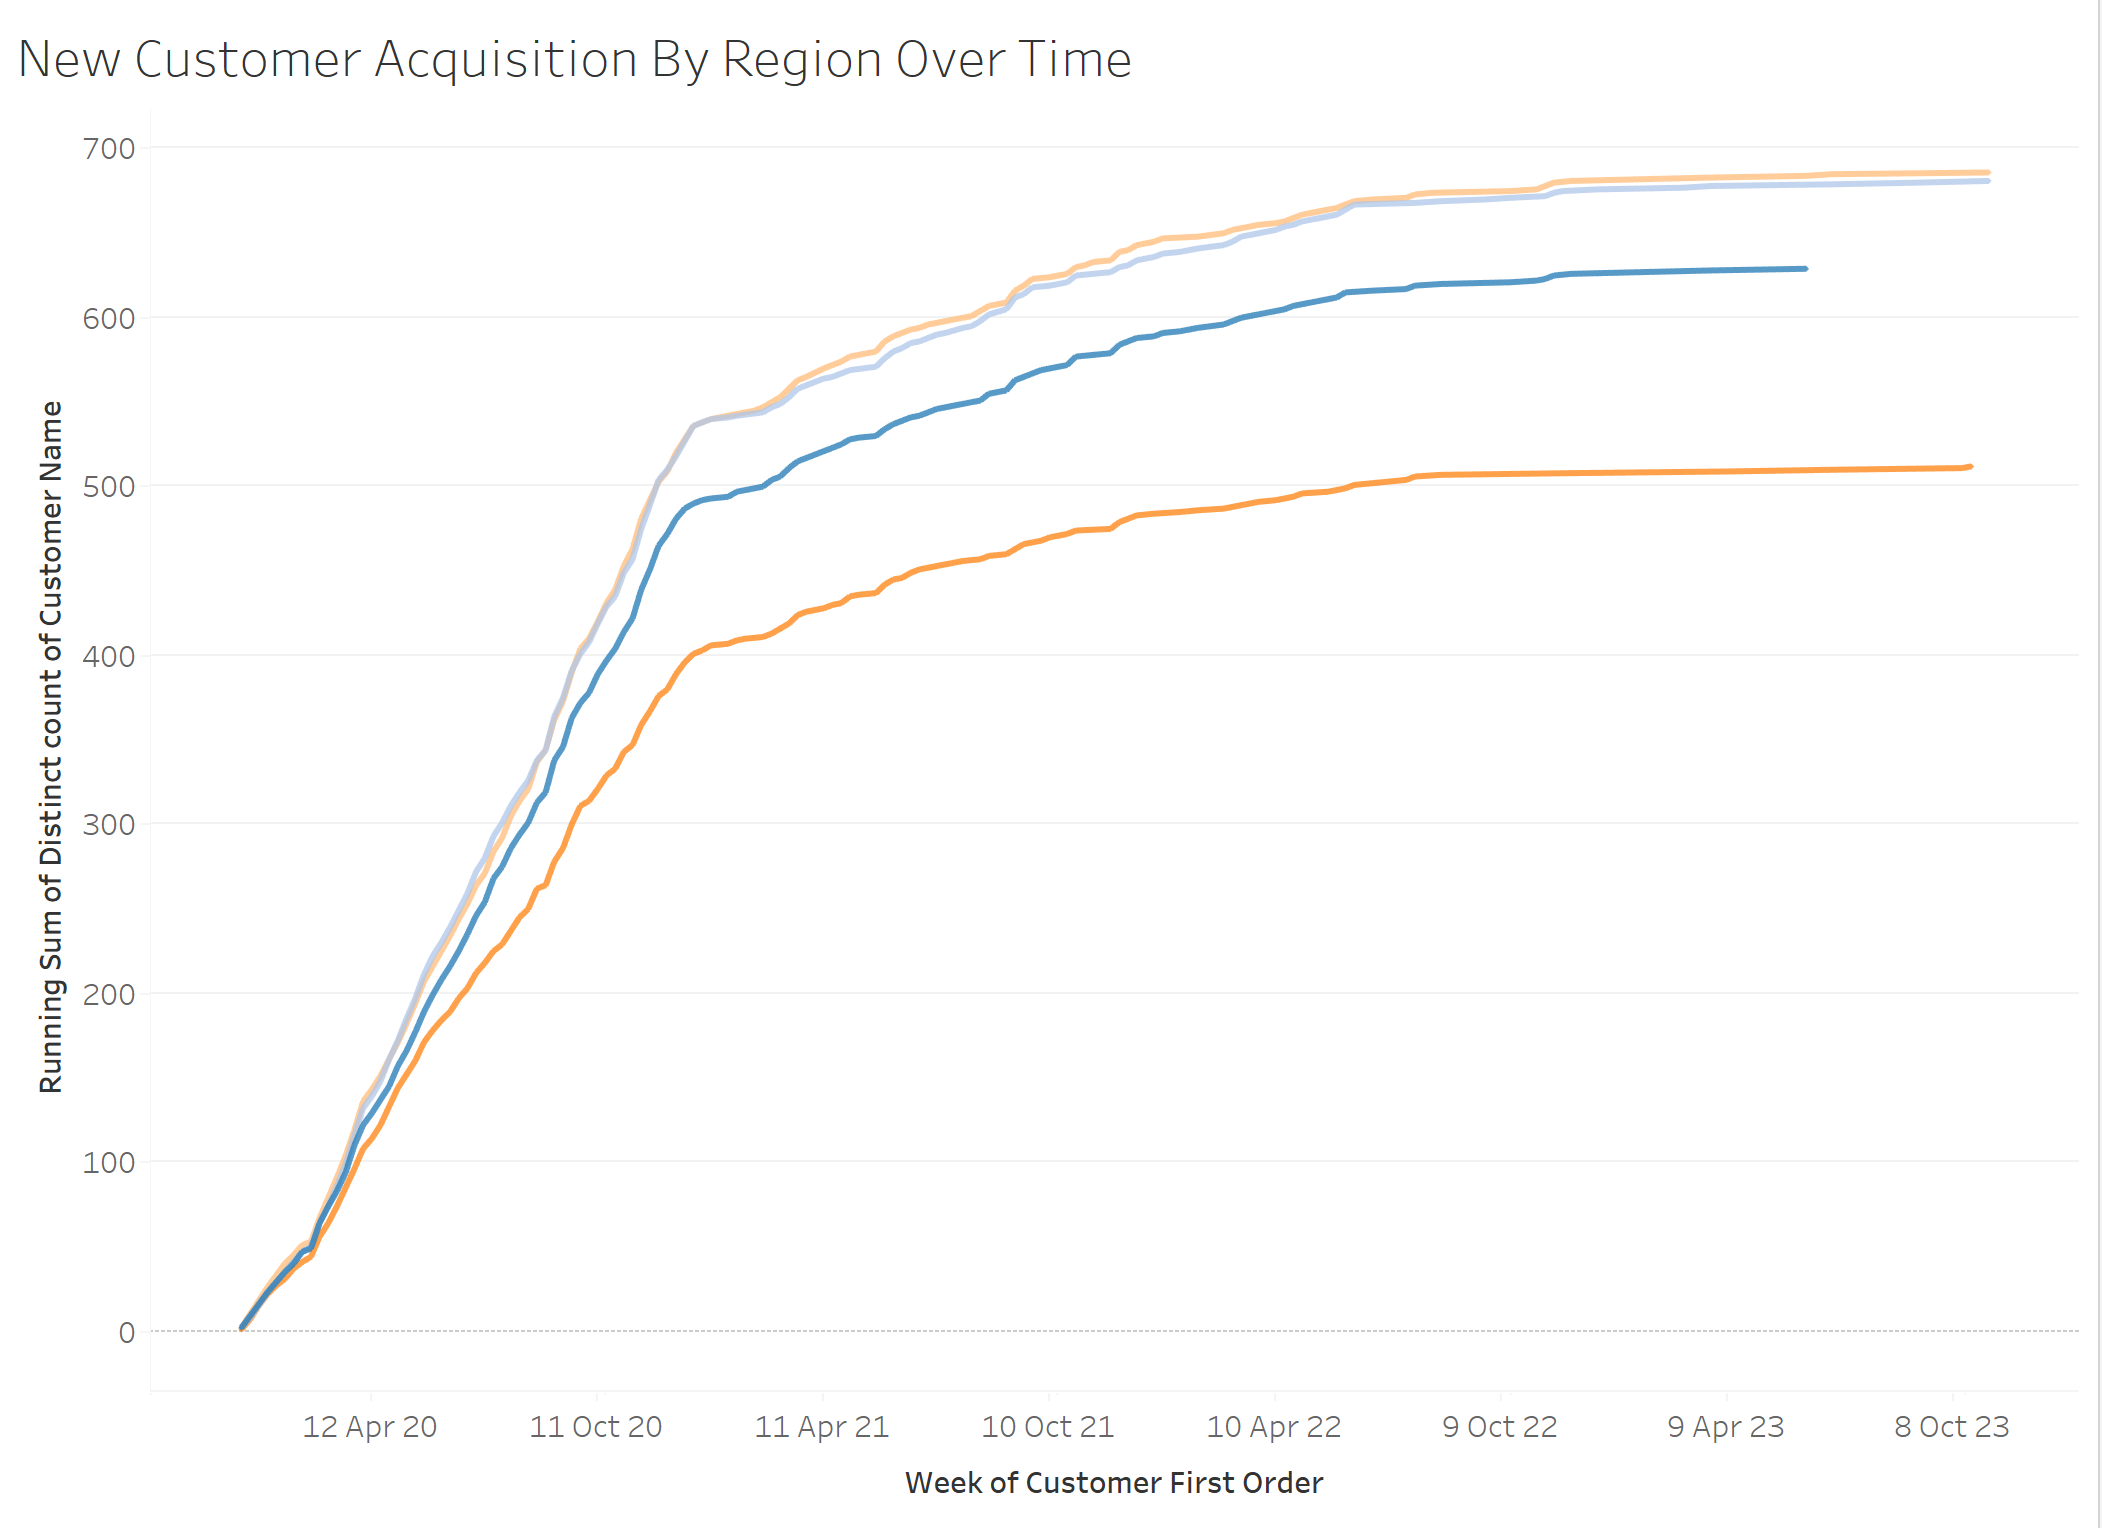
Consider the following example. We want to create a chart, like the one below, displaying new customer acquisition by region over time but the only relevant fields we have is 'Customer Name' and 'Order Date'.
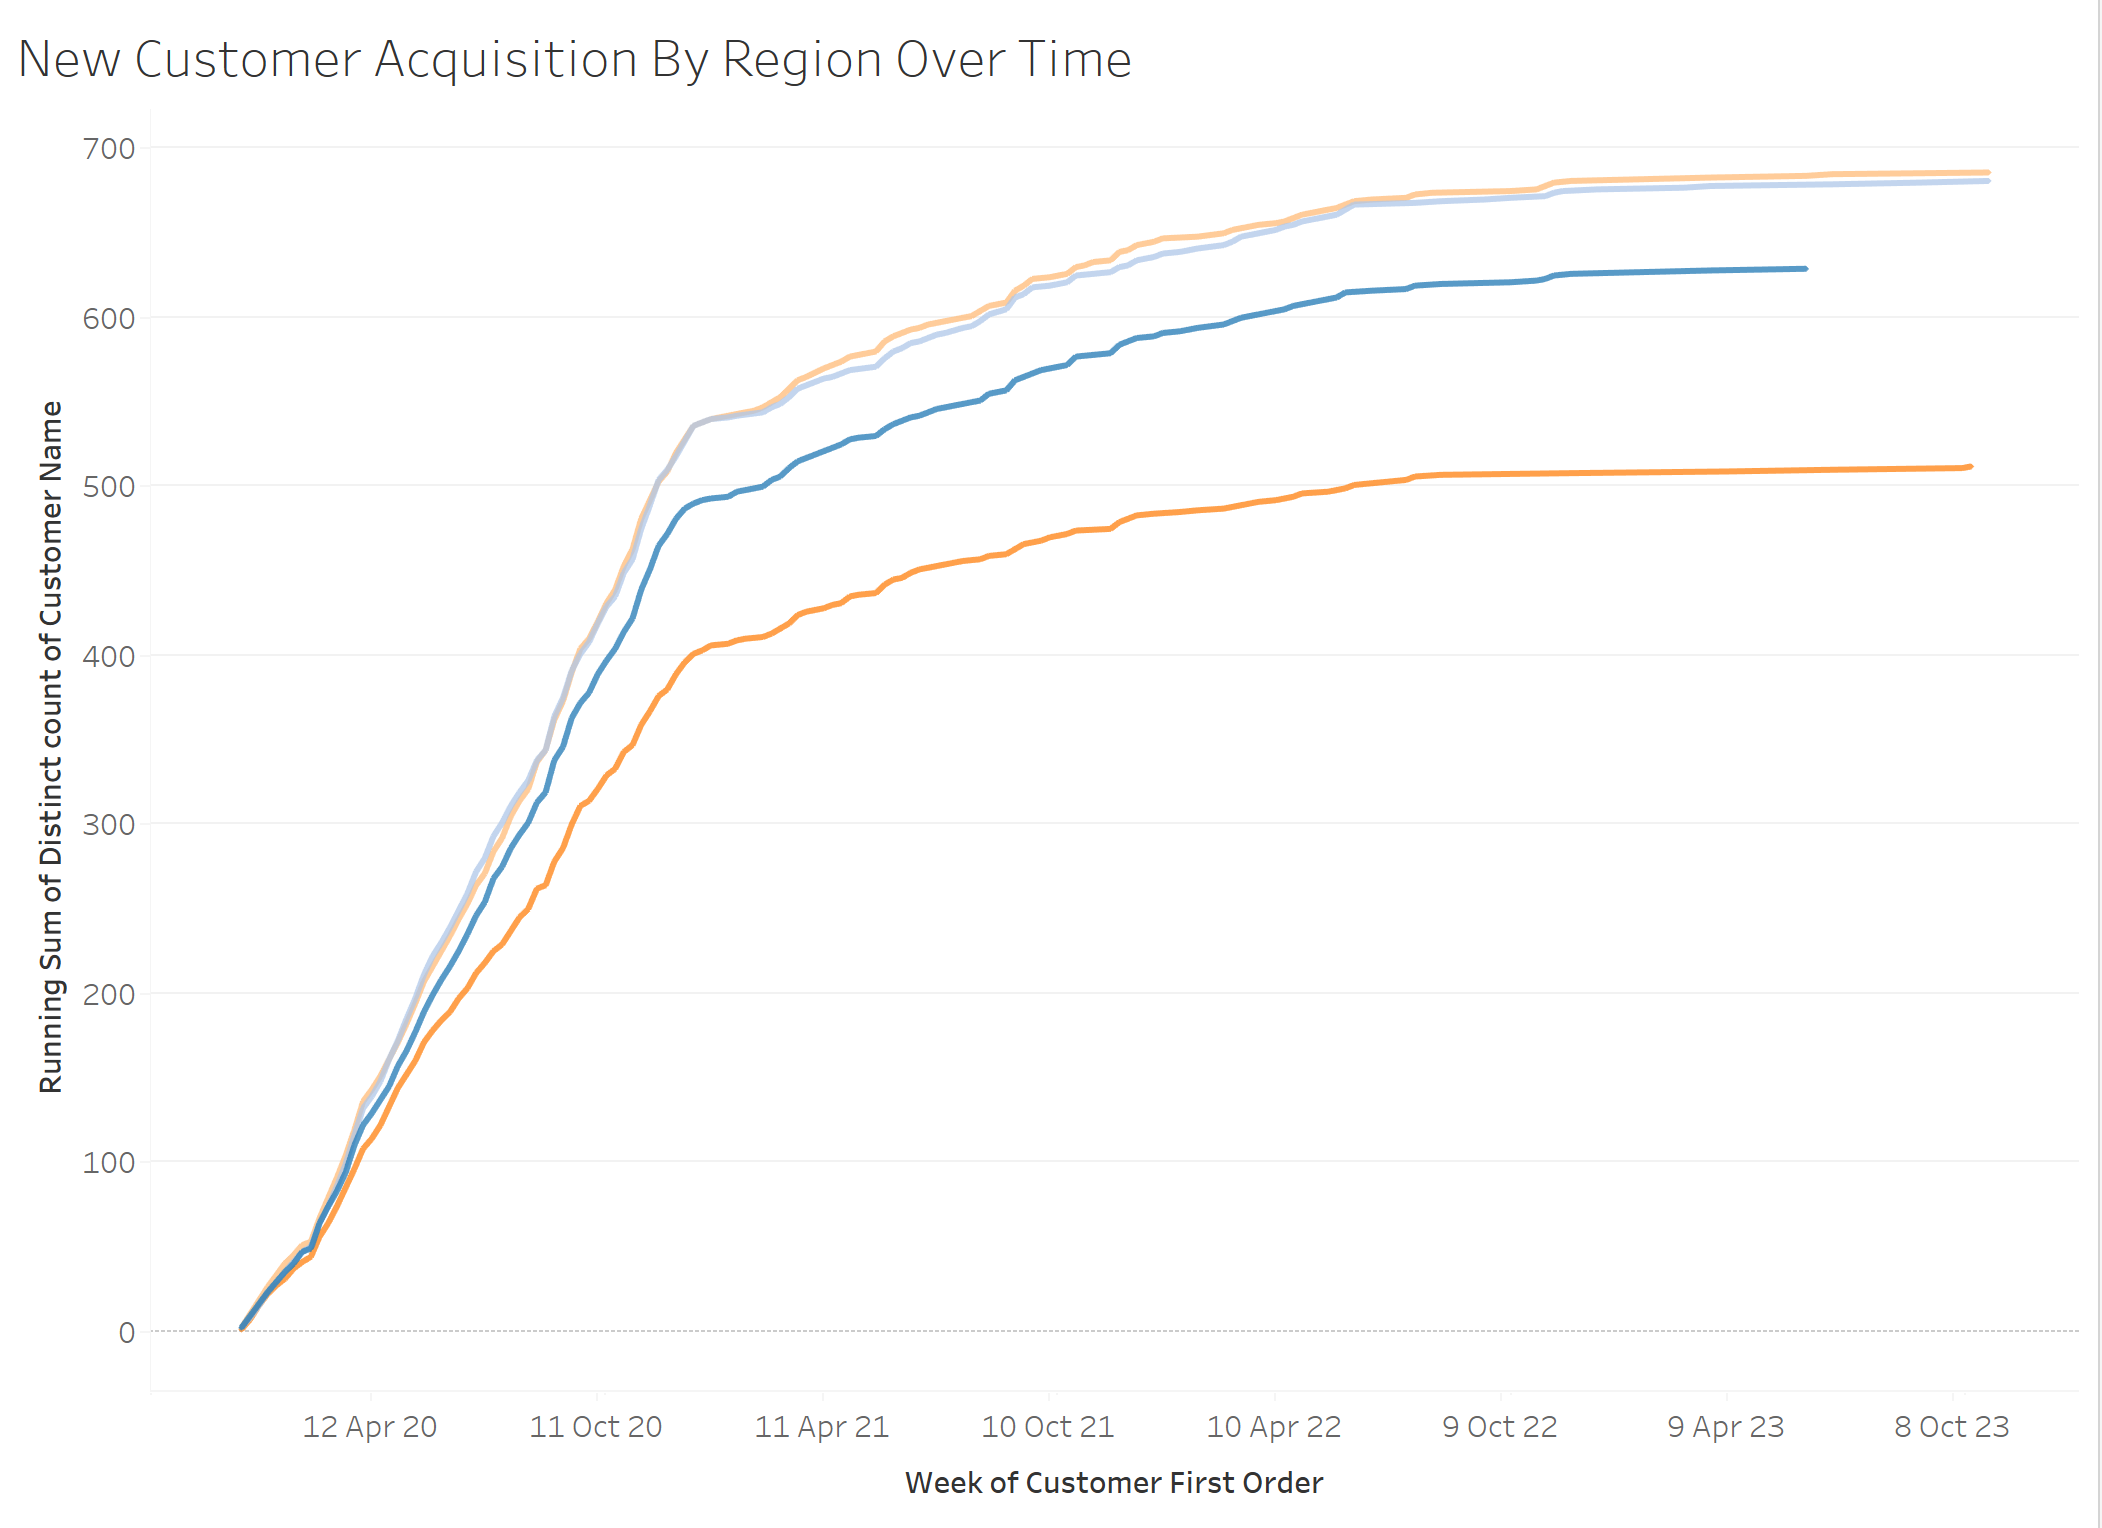
Our first step is to find the date that each customer made their first order. We can do this by using a fixed LOD, which will look like this:
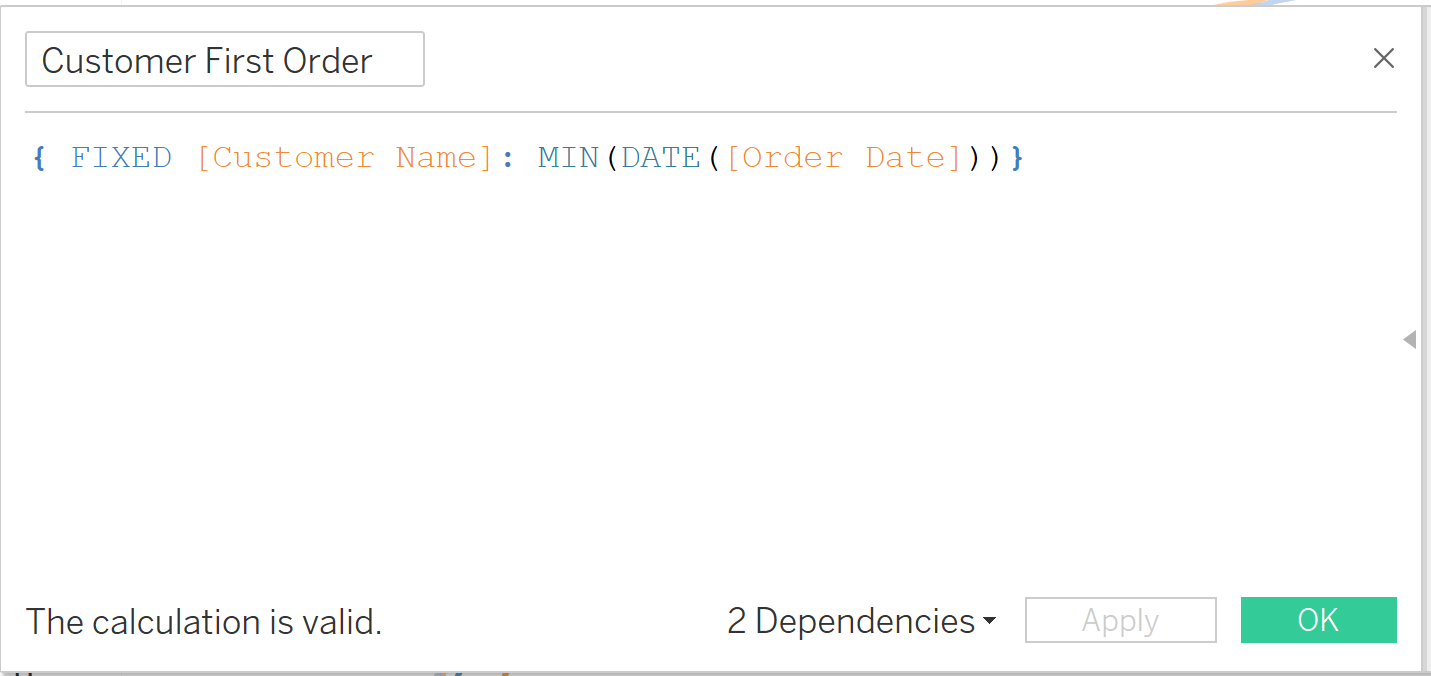
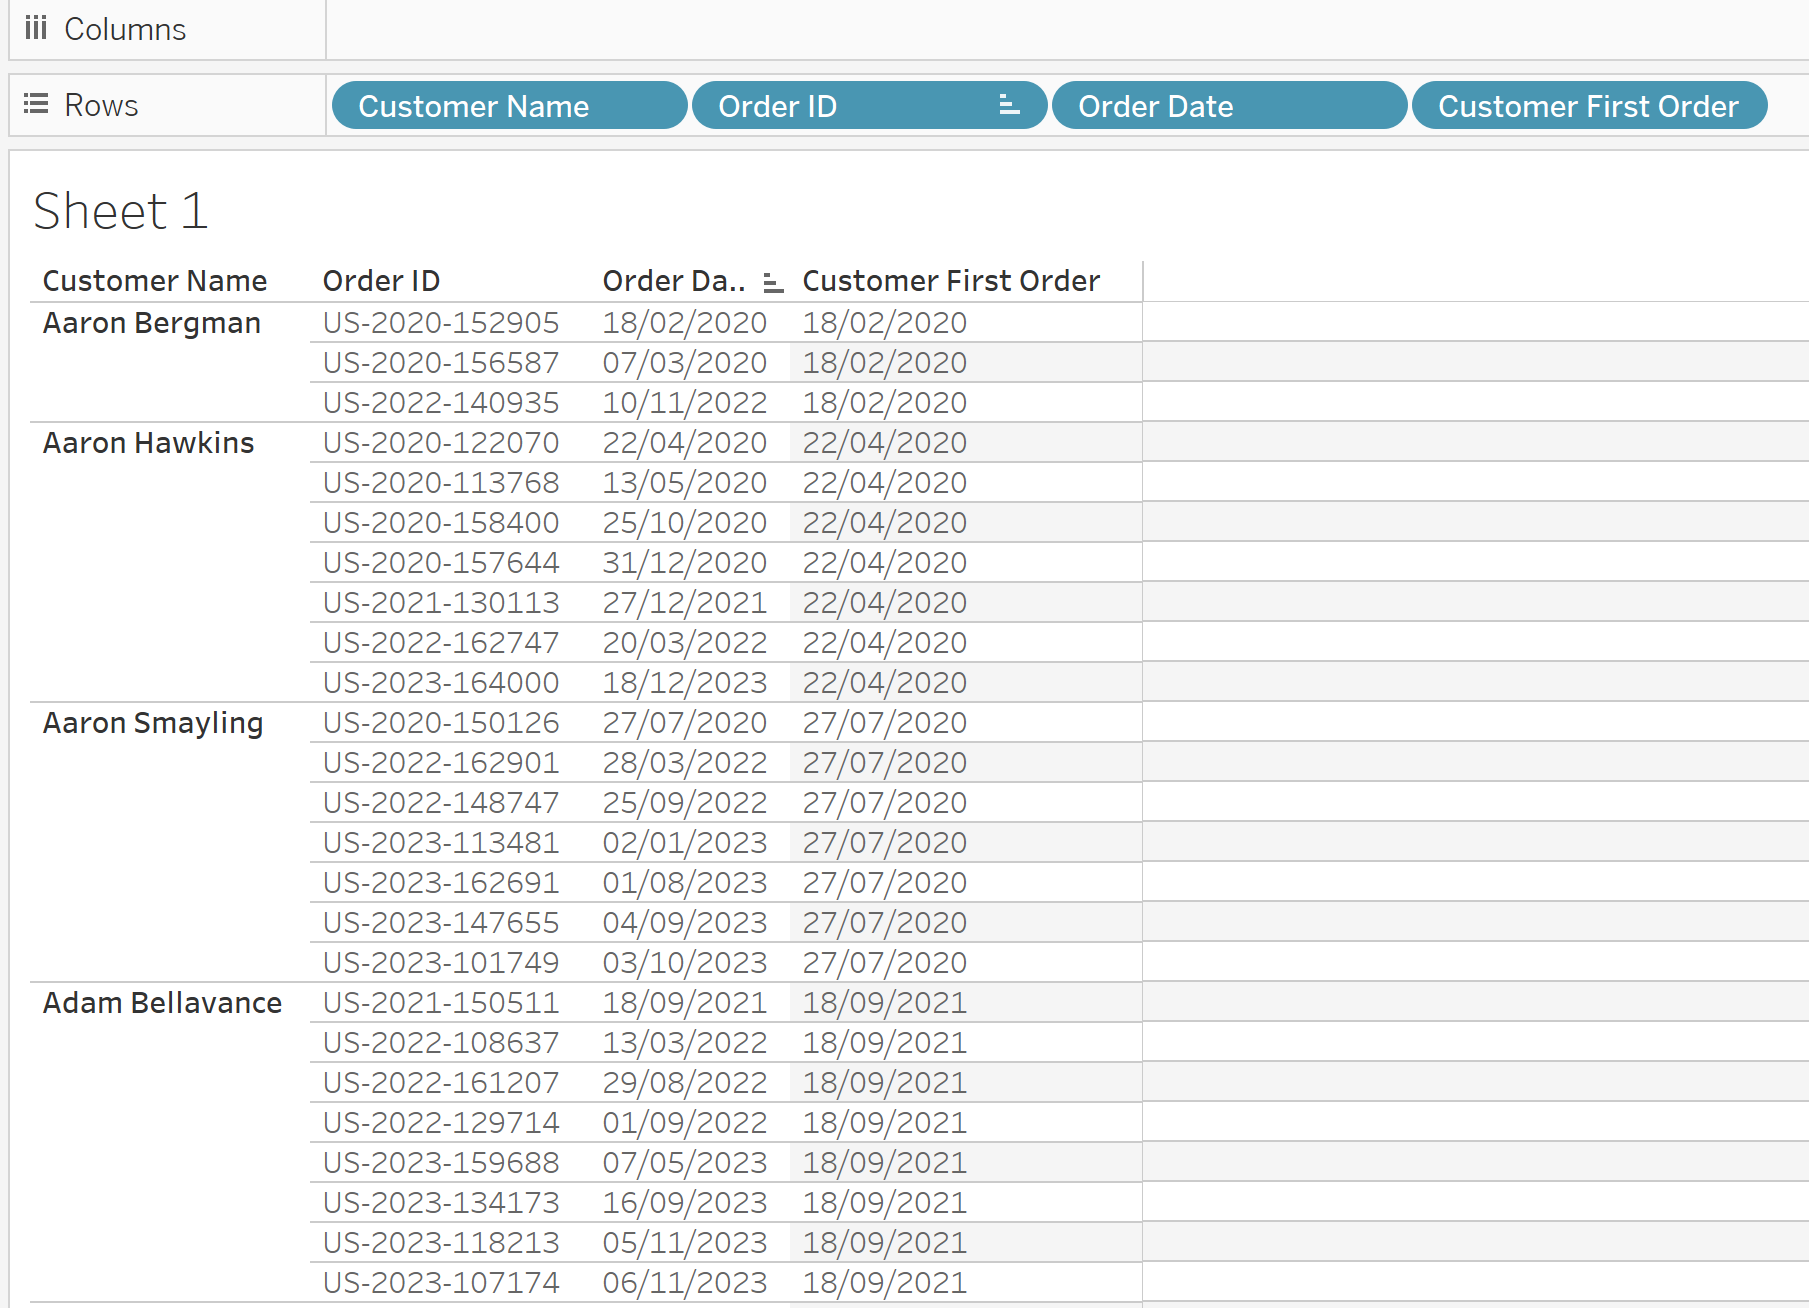
In plain English, this calculation is basically saying "for every customer name, show me the minimum order date". We can verify the calculation in the table below which shows every order by customer, order date and minimum order date (the calculation we just created).
Now, to create a timeline of new customer acquisition by region we can drag our "Customer First Order Date" LOD calculation onto columns and a count distinct of "Customer Name", followed by "Region" on the colour card.
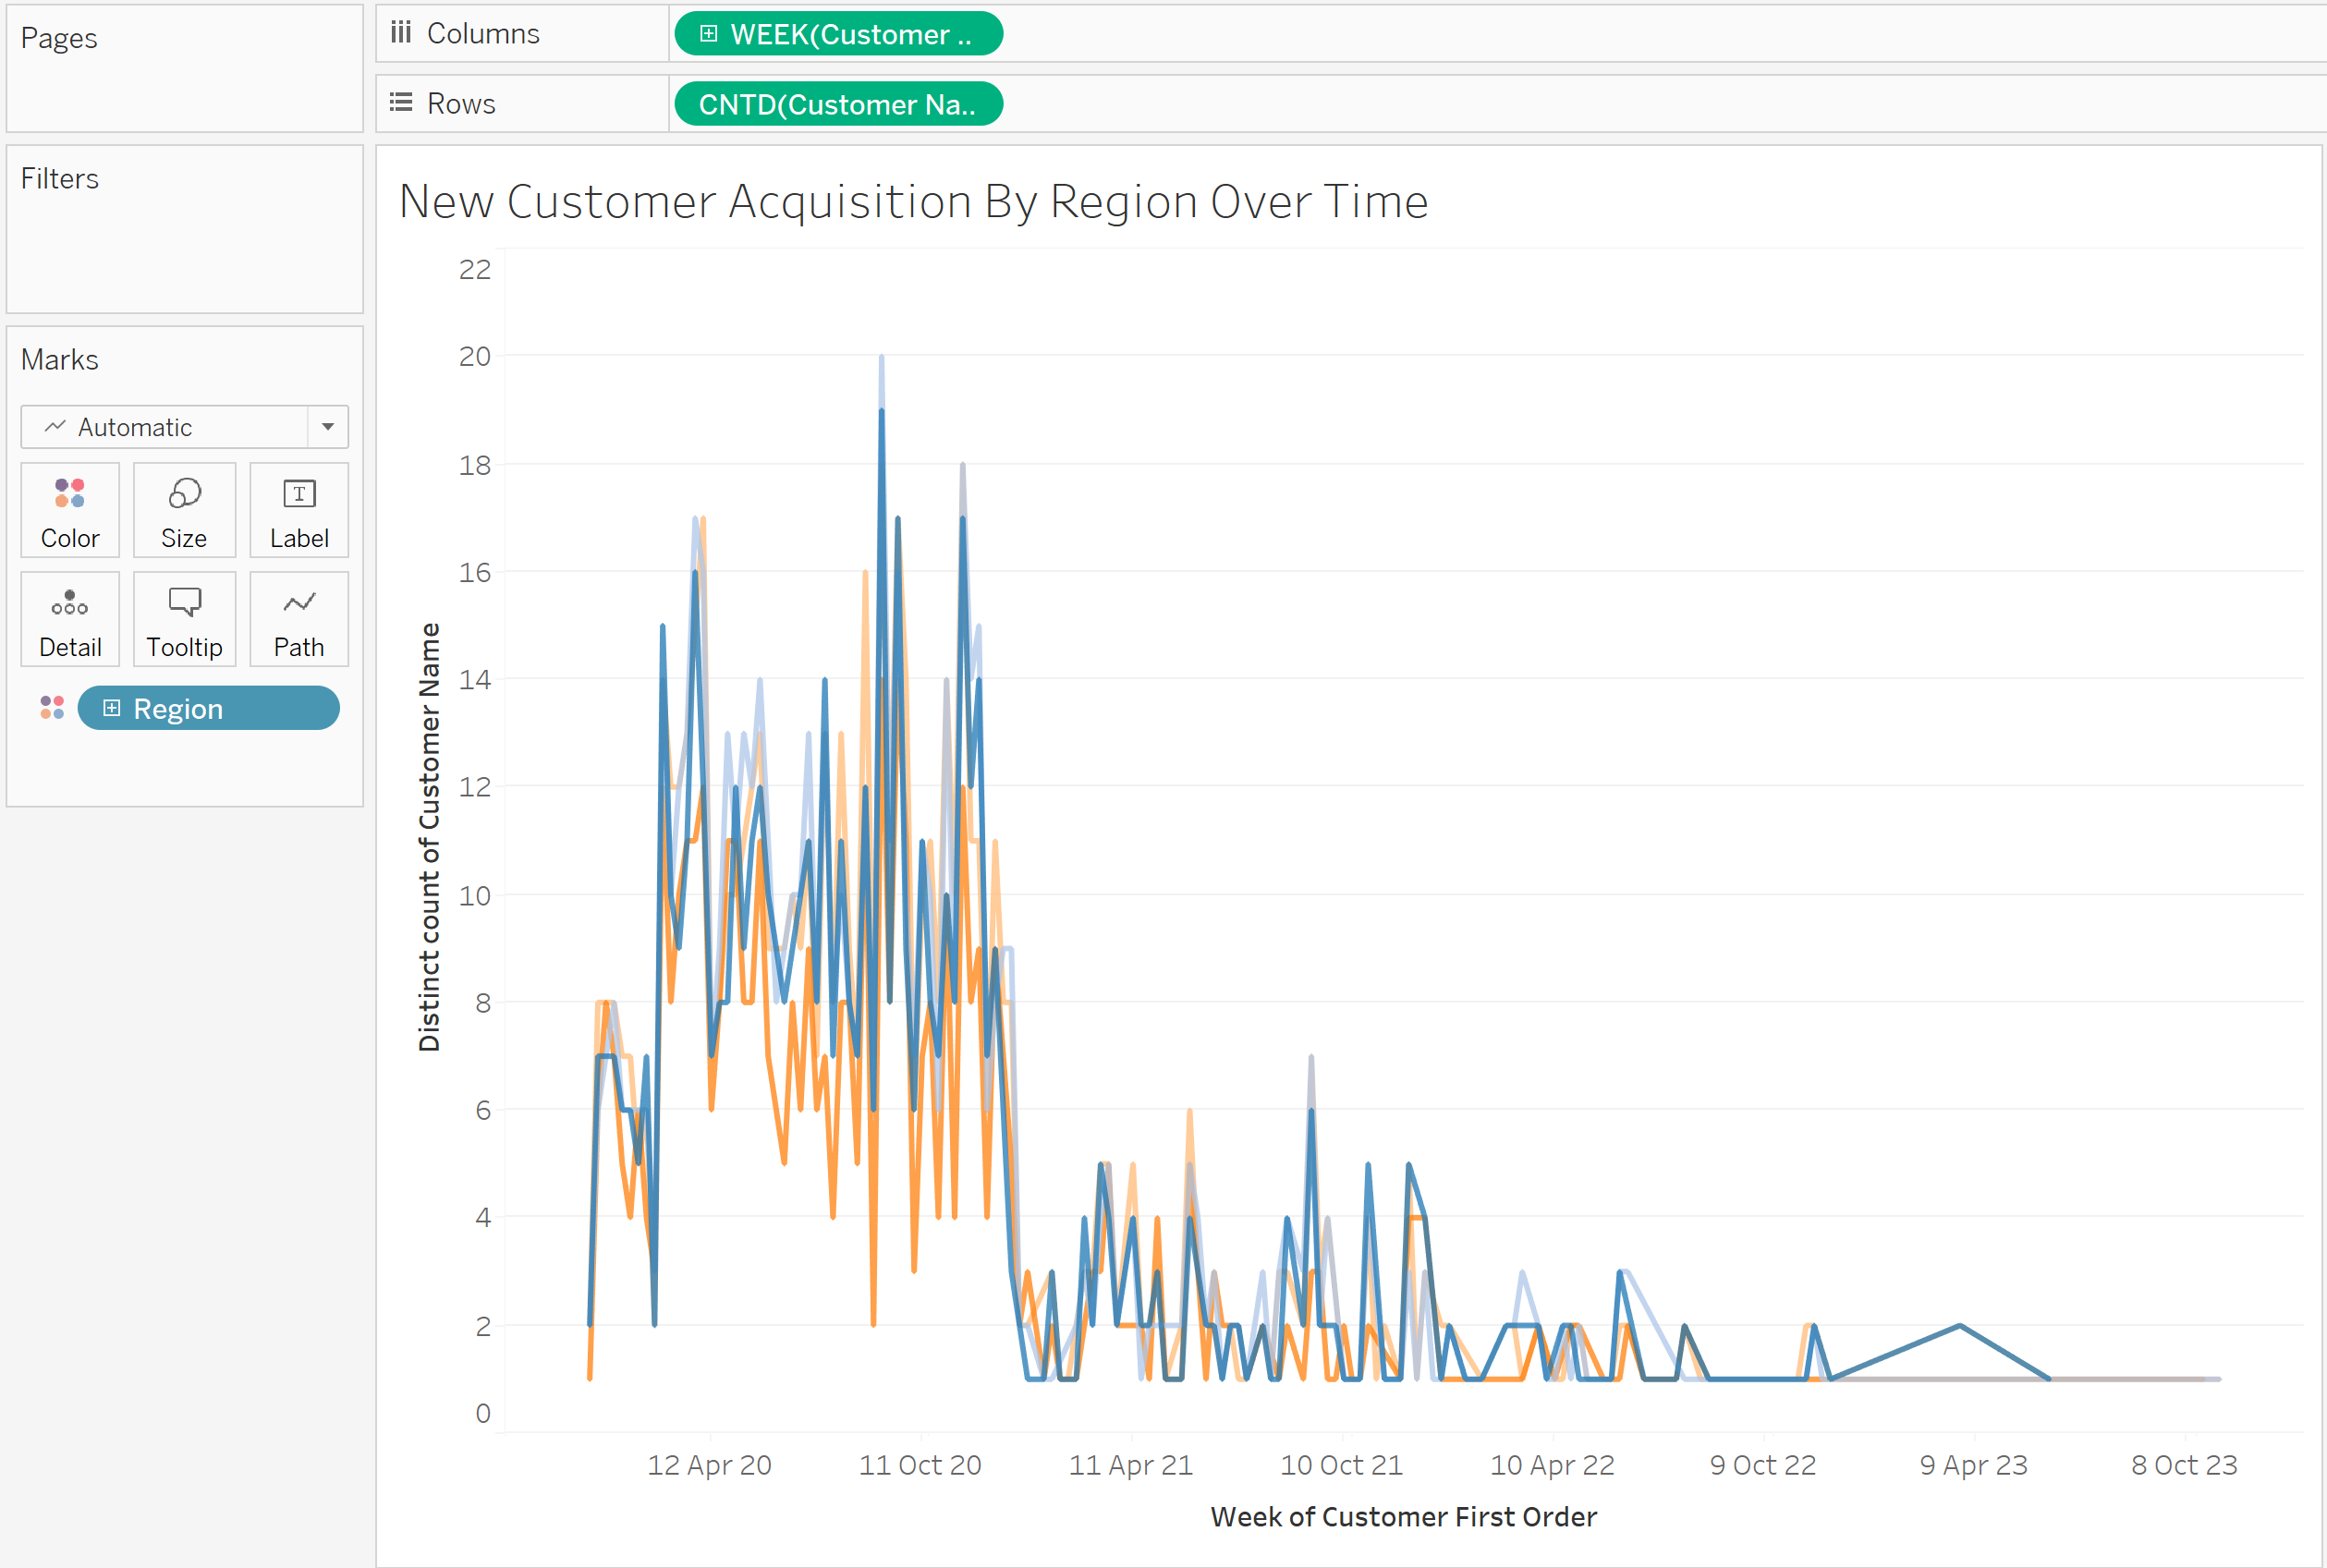
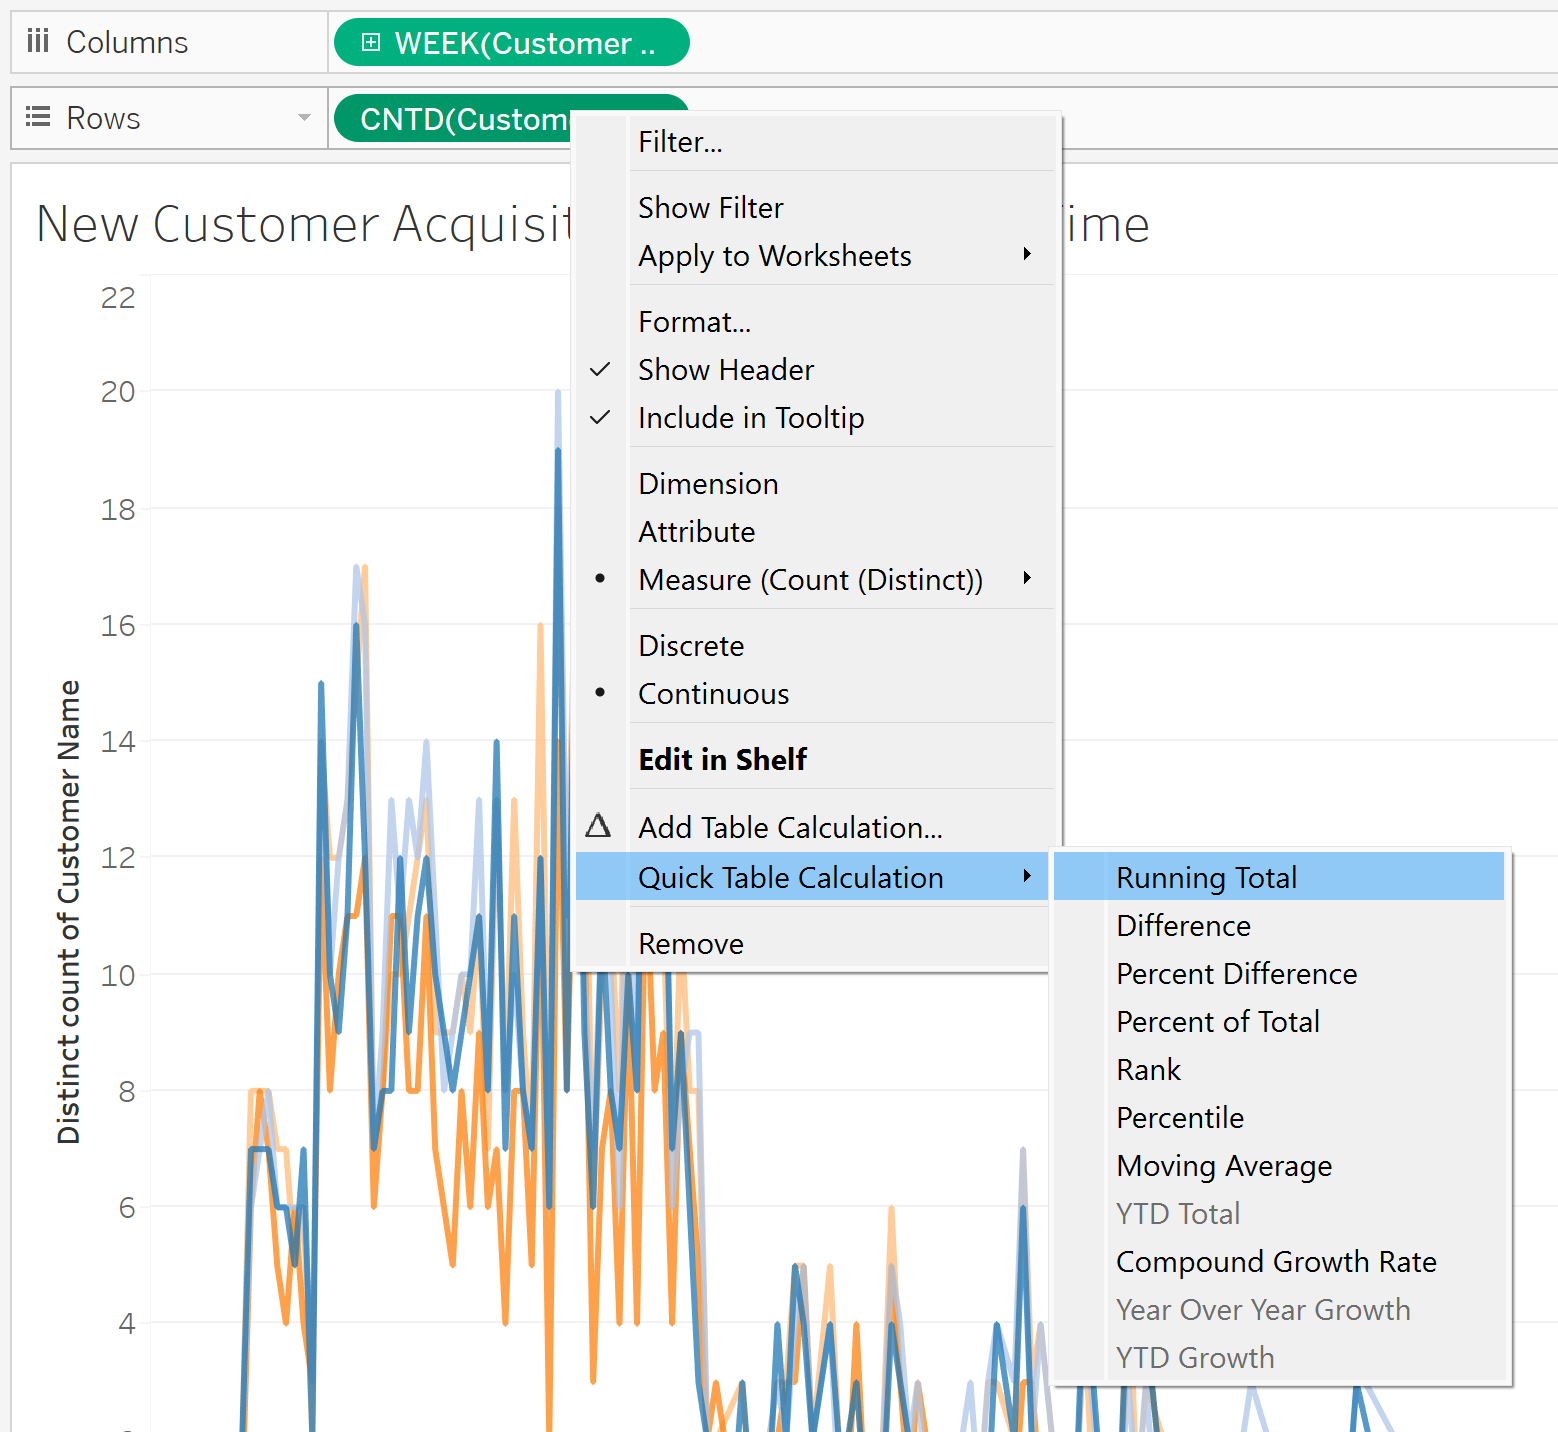
This is now showing the distinct count of customers as and when and only when they make their first order. In this scenario, we want a running total of this measure so that we can see the total customer base over time. The fastest way to do this is to right-click our CNTD(Customer Name) pill in our row shelf, and click 'quick table calculation' followed by 'running total' as shown below.
And that's it!
This is just one example of how we can use Level of Detail calculations in practice. There is a great post in the Tableau forums demonstrating the top 15 scenarios where we can use LODs which you can find here.
