Screenshot of the multi-field and multi-row tool icons
Found within the 'Preparation' tool tab, Multi-Field & Multi-Row Formulas may look and sound very similar (I know I have definitely placed the wrong one in my workflow before) but their roles are very different. Understanding the function of both tools is essential to working effectively within Alteryx.
Multi-Field Formula
The Multi-Field Formula tool, you may be surprised to learn, allows you to apply a formula across multiple fields (columns) simultaneously. Lets look at how this tool can work in practice:
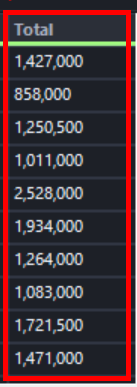
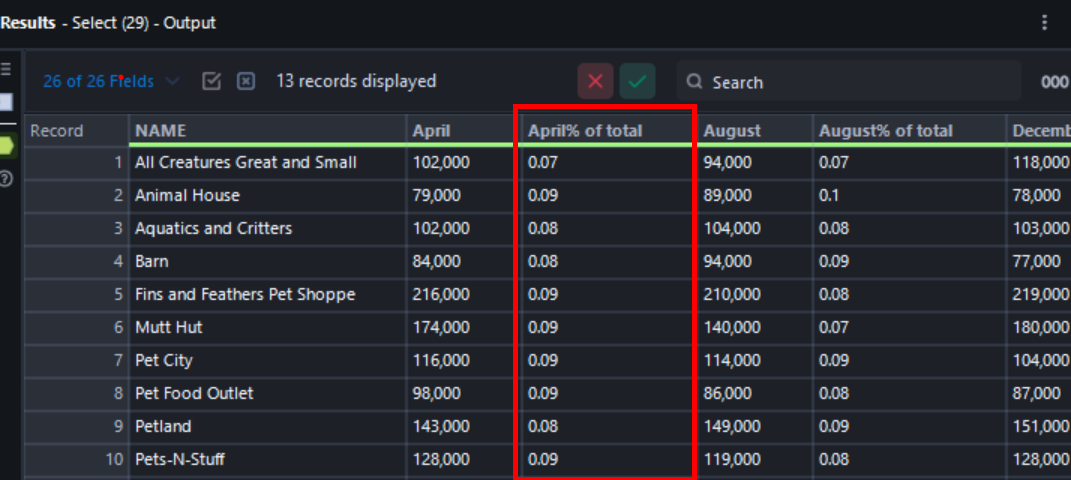
We have a dataset which contains the monthly sales for a list of books, with a total sales column at the end.
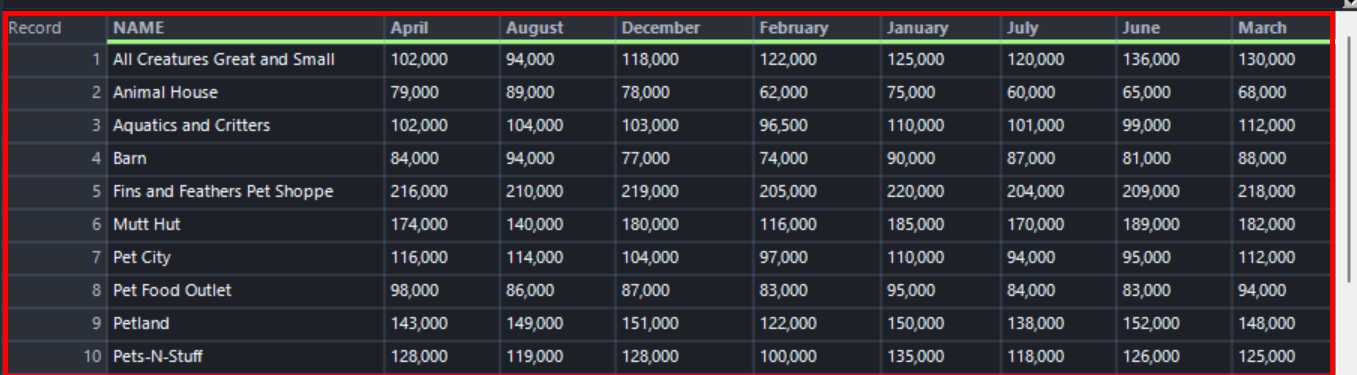
We want to work out what the percentage of the total sales each month equates to. However, I don't want to have to create 12 formulas in order to create a '[Month] % of sales' field for each month. Instead, lets just use a multi-field formula. To do this we select all the fields we want the formula to apply to as well as create a name for our new columns. Now to make our formula; [_CurrentField_] equates to every field that you have selected in the configuration pane, thus to create our '% of sales' fields we simply do:
[_CurrentField_] /[Total]
Which means that for every month selected divide its sales value by the total sales for that year.
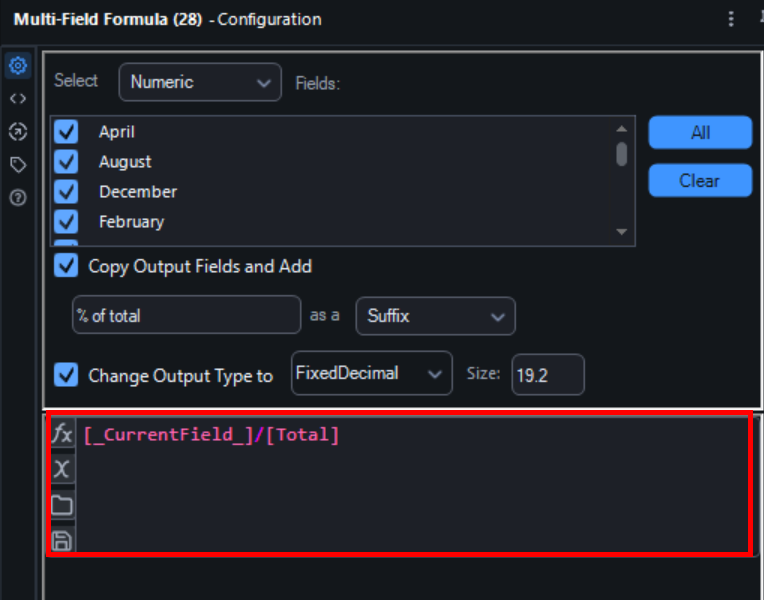
As you can see we now have Monthly % of total fields for April, August and every other month in our table.
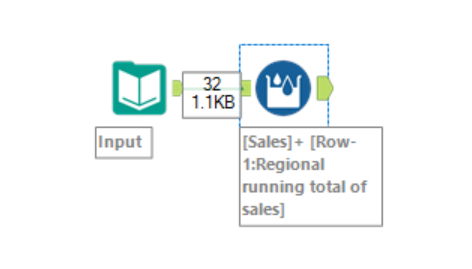
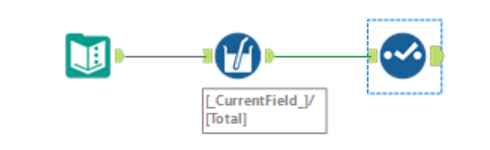
Here is what the final flow looks like:
Multi-Row Formula
Again, as its name implies, the Multi-Row Formula tool allows you to apply a formula across multiple rows within a table simultaneously. Here is an example of how the tool can function:
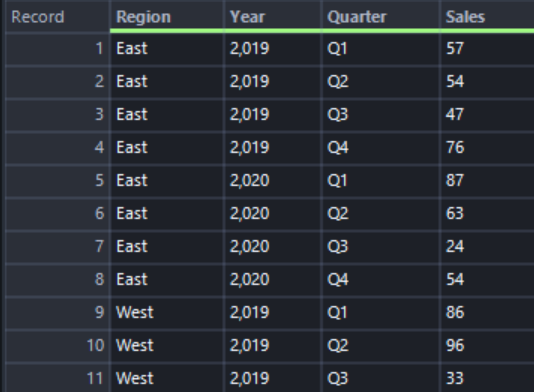
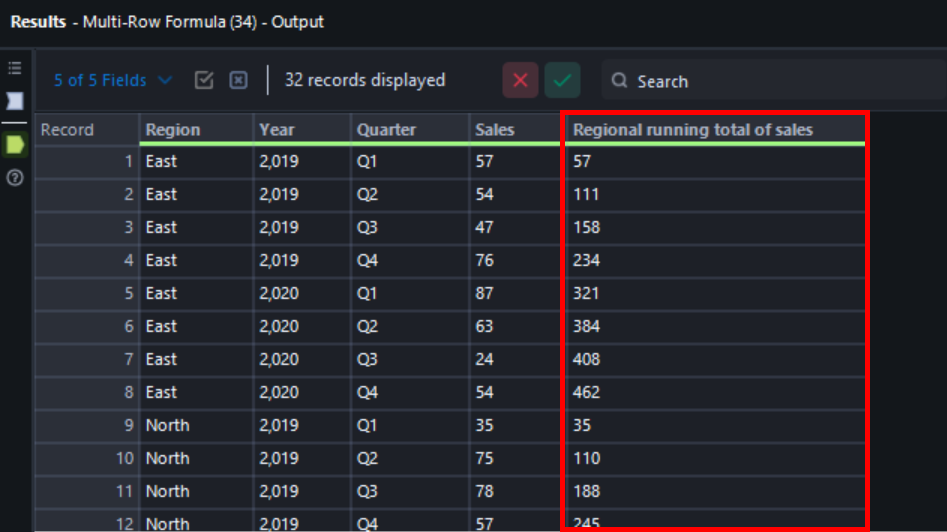
We have the quarterly sales data for each region from 2019-2020. We want to see the running total of sales for each region over those years. To do this we can use the Multi-Row Formula tool.
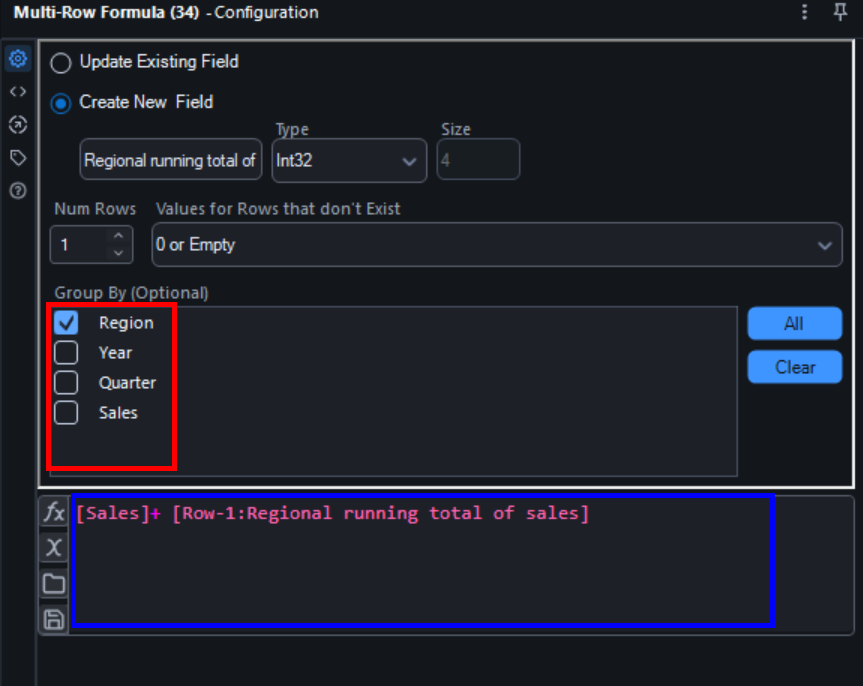
Once I bring in the tool I can choose whether to either update an existing field or too create a new one. Here I created a field called 'Regional running total of sales'. I then chose to Group by Region as this means that my running total will 'restart' with every region. Next I created a formula which adds the latest quarters sales to the previous quarters running total. This translates to [Sales] + [Row-1: Regional running total of sales] . [Row-1 : ....] is unique to multi-row formulas and and in essence tells your tool to look at the row before the row it is operating at. So in this case look at the previous running total of sales value and add it to this quarters sales.
This will then produce a field like this:
Here is the final workflow: