


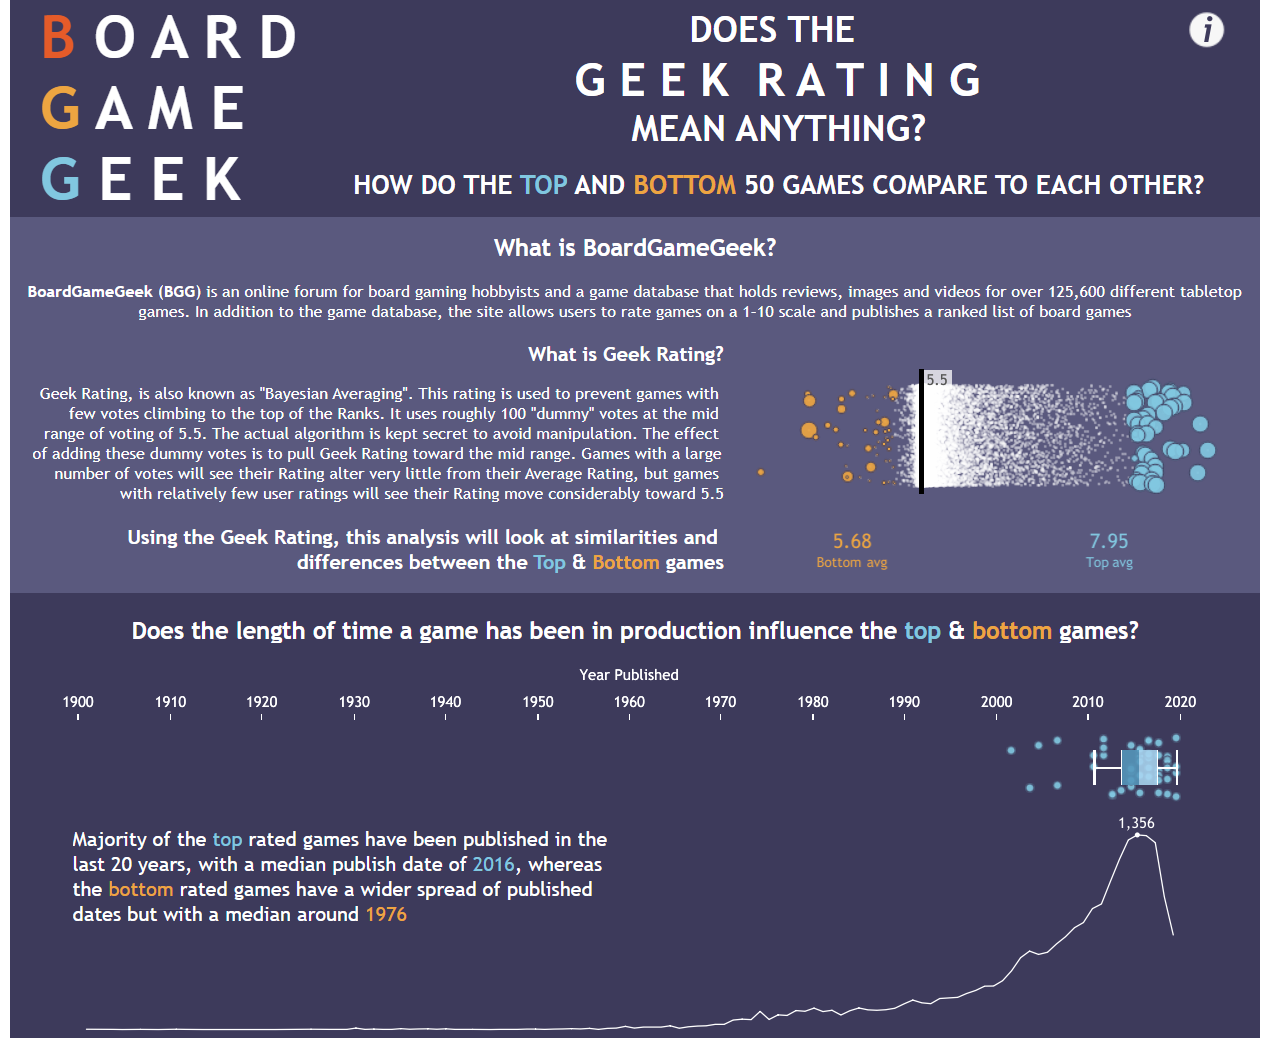
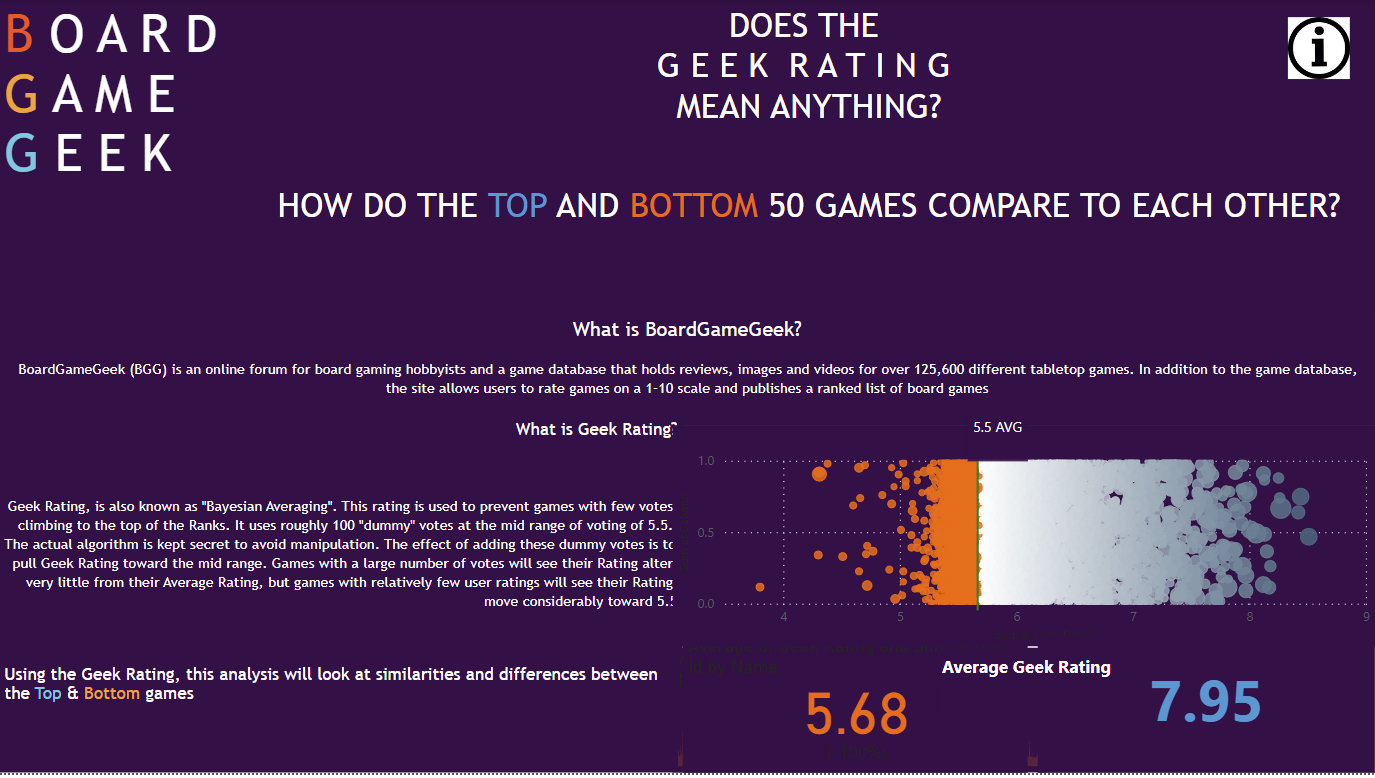
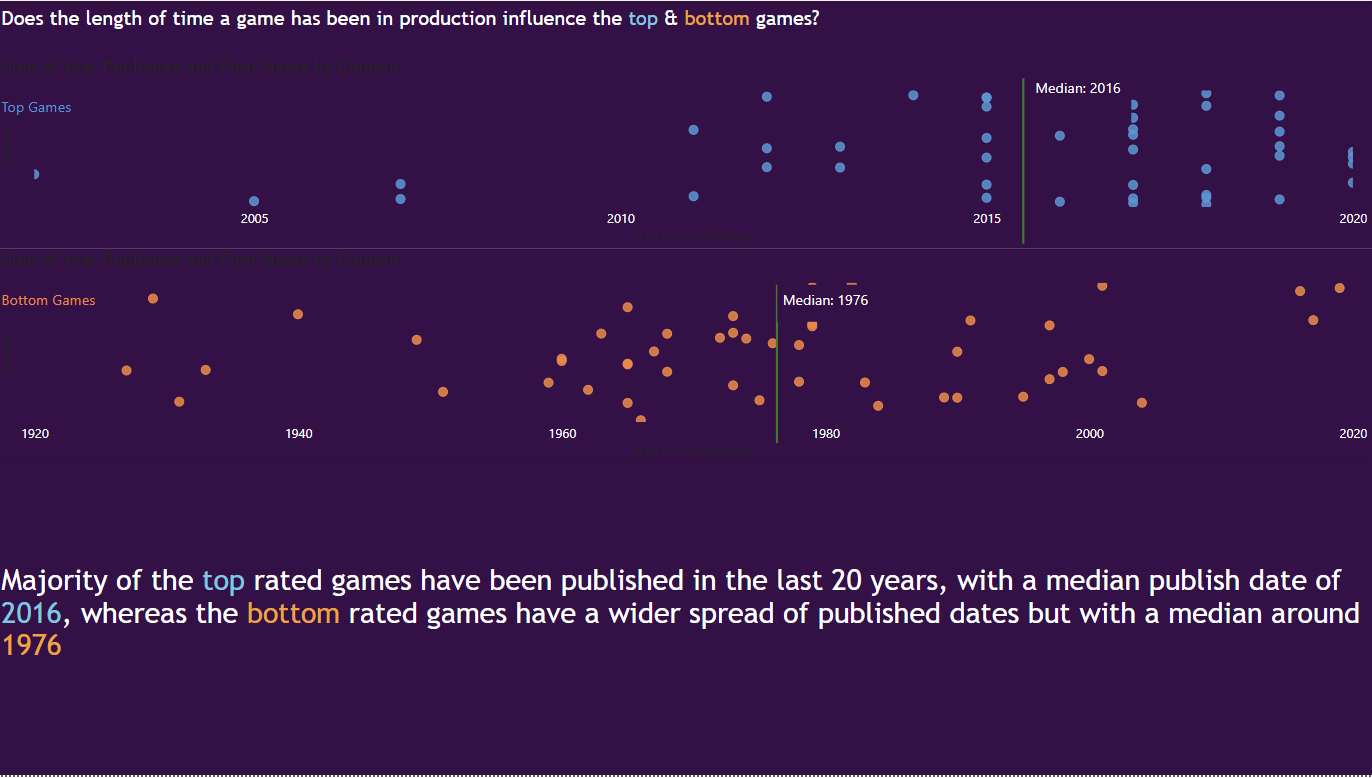
Today's dashboard week was a PowerBI Centric day where we recreated some of the dashboards created in Tableau by the coaches. We were given a choice of which dashboard to recreate on a first come first served basis and I was slightly too slow, and was left with the choice of the remainder. I settled upon recreating the following dashboard made by Lorna: #IronViz 2023: Does the Geek Rating mean anything? | Tableau Public
As it was a redesign, no sketch was conducted today bar some initial notes on what I might need to find out and what charts might require a bit more time , for planning purposes.
PowerBI is still very new to me with just a single day of learning the tool under my belt. I was impressed with how intuitive certain aspects of the tool were. Some of the charts required a bit more investigation from resources online. I didn't manage to replicate the entire dashboard but made good progress and learned plenty throughout the day.
Got 2/3rds of the way through replicating the dashboard and was able to learn a whole lot more about PowerBI, so altogether a succesful day and a fairly enjoyable one too. Overcoming the little obstacles encountered by researching online via forums, websites and youtube vides was satisfying and great learning points.