After 16 weeks of training, dashboard week is finally here and our first day of dashboard week was upon us.
Today we were tasked with creating an analytical app on Alteryx concerning crime data in the UK. Bringing in a range of datasets was the first problem, solved by using alteryx and its wildcard match function to bring in different csvs in one input tool. The resultant workflow was as follows for the App
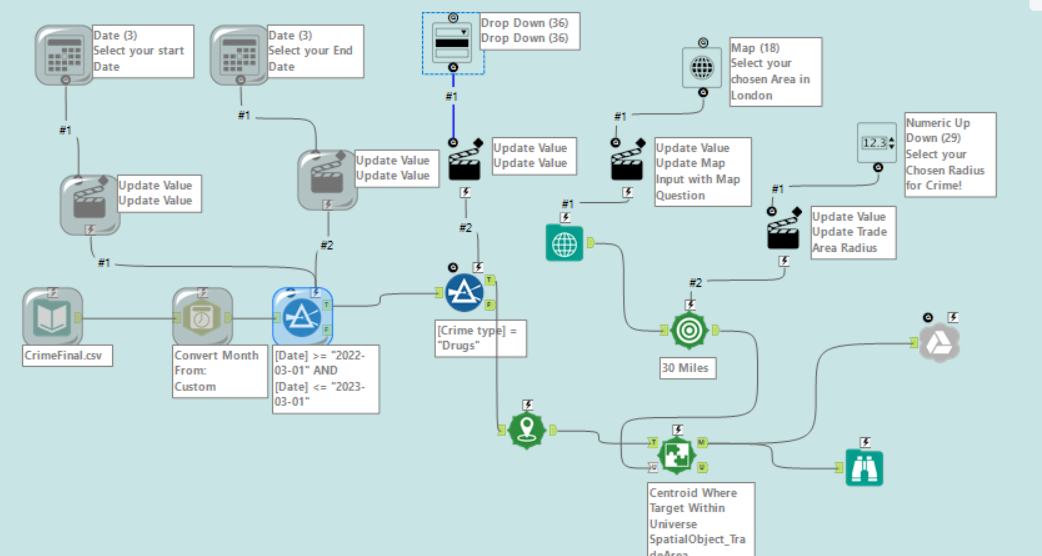
The app was somewhat fiddly with little bugs and errors popping up every so often, disrupting my carefully planned day of work. I had to use a google output tool to get it onto sheets and this was slightly buggy and causing further stress
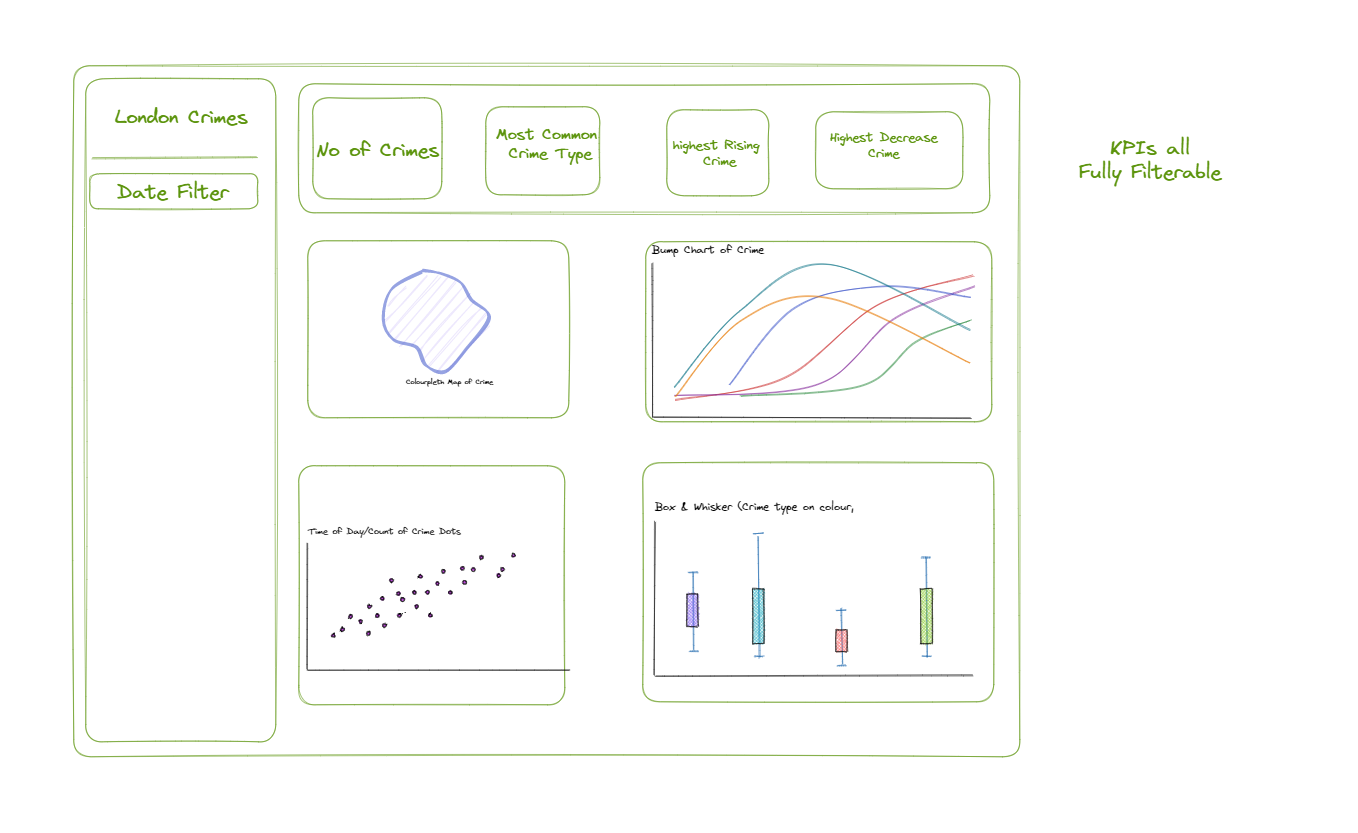
I then sketched out a plan for my dashboard: My plan was to keep it simple, but informative and leave enough room to have a nice, albeit limited, final product.
I had some further technical issues when it came to connecting my google sheet data to tableau and with another hour or so I think I could have got to the final product I would be relatively happy with. In the timeframe for today however, this was my dashboard:
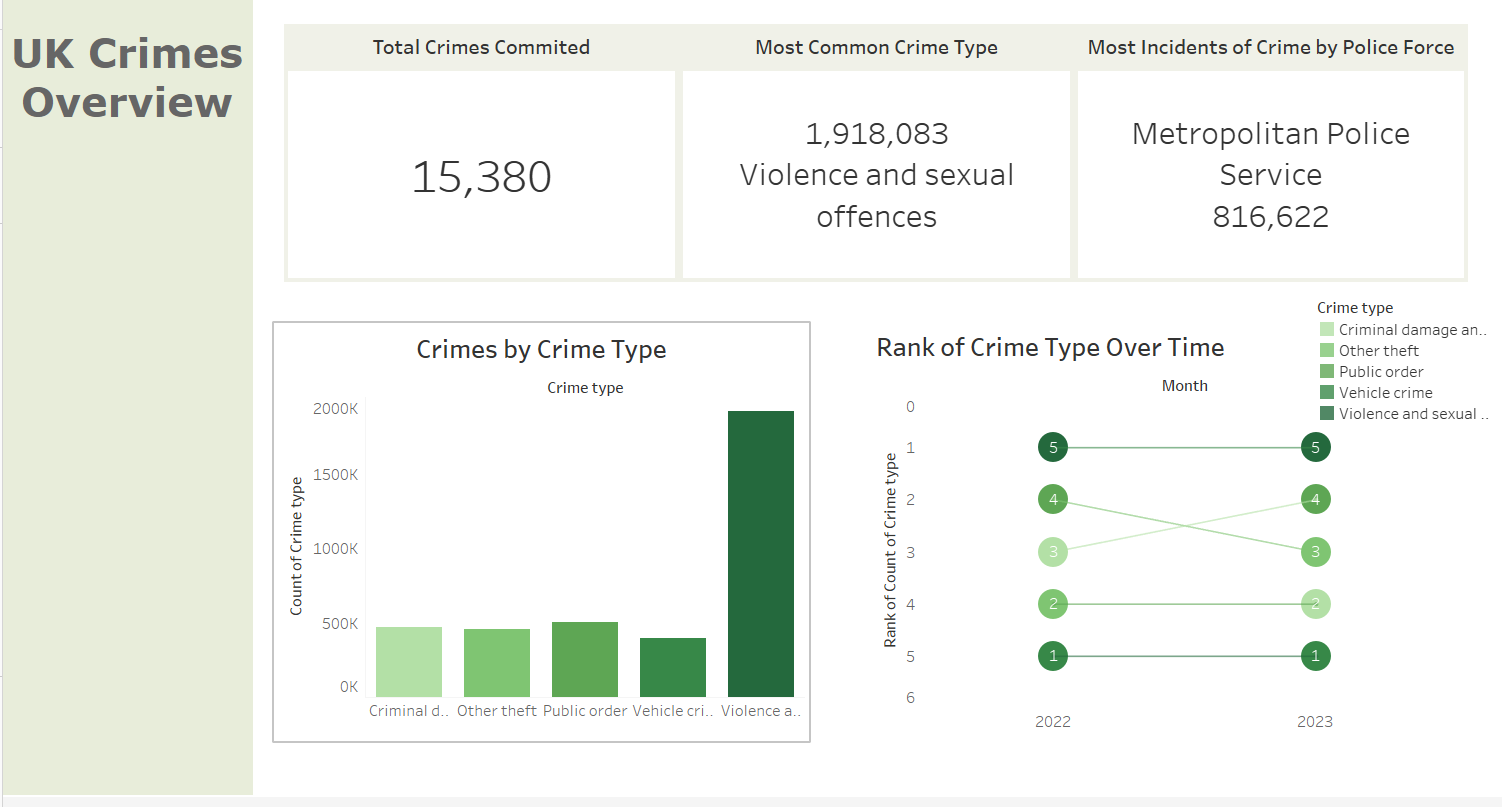
I'm not particularly happy with the final dashboard. But creating the app and using some tools I have used sparingly before was excellent practice. I did not manage to get the last two charts done, and overall polishing up the dashboard ie formatting, colour, tooltips etc.
Overall it was a good learning experience and hopefully the rest of the week will be an improvement. This was a good indicator of the speed of work required from myself, and an importance lesson as well in the importance of scoping carefully to ensure you can complete the required objectives given to you.