


A pivotal moment in a burgeoning analyst’s data preparation journey is learning the methods used to combine different data sets. In Tableau Prep, we’re able to do this via data joins and data unions.
Why is this practice crucial?
Data never lives in one place, or in the perfect shape. Data engineers often split up data across different systems or tables, by department, source, or other logical reasons. That means that analysts frequently need to use joins and unions to reassemble it. The alternative approach - having a single master table that contains all fields and rows ever used - would be cumbersome and a workflow nightmare to maintain.
Joins and unions will work with structured data: any dataset that is defined by rows and columns. One can think of unions as extending a dataset vertically (adding more rows), and joins as extending it horizontally (adding more columns). A common pitfall in creating both joins and unions is not taking the granularity of the tables into account.
We'll start with unions, since they're the more intuitive of the two, and granularity issues tend to show up in a more visible way there before we tackle the added complexity joins bring.

Unions
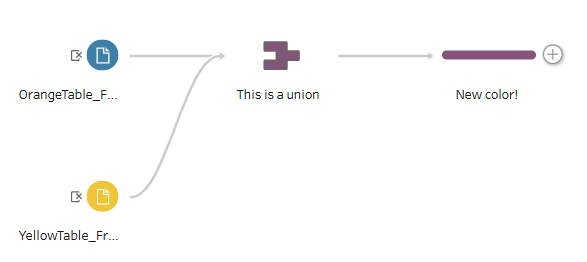
Unions stack datasets with the same or similar columns on top of each other. In Tableau Prep, they are represented with the above building-block icon.
Unions have a lot of great use-cases: you might have a report that is updated on a schedule, such as monthly sales numbers - but may need to see the entire year together for your analysis. You also might be analyzing the same data across different categories - such as a finance report for different products.
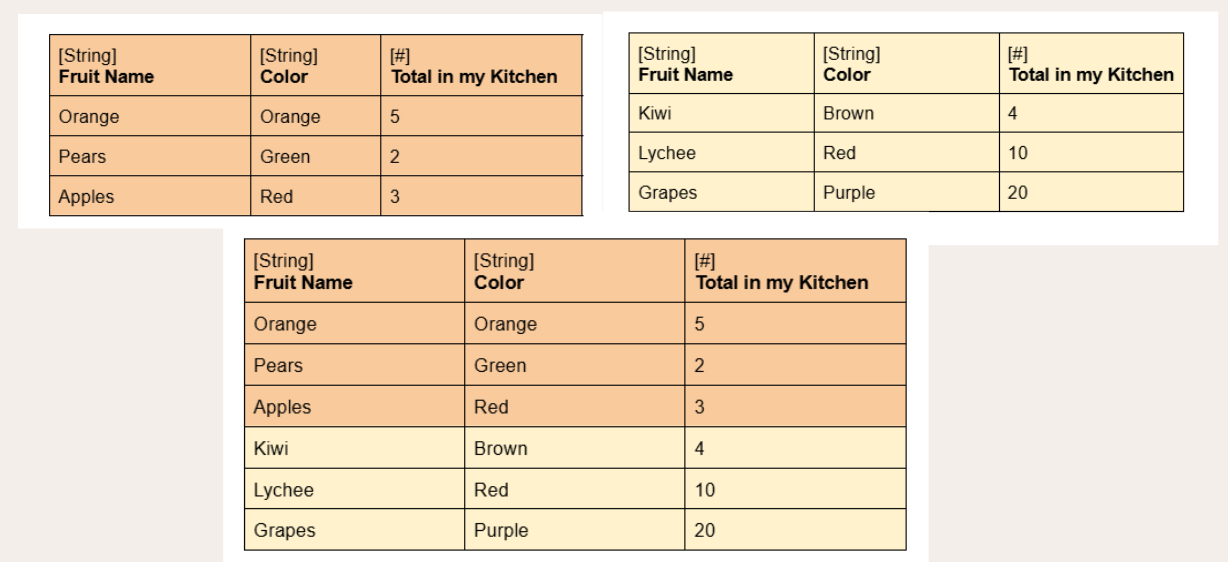
Tableau Prep reads the name and metadata of all columns to produce matches. The intended result is for all data to map on top of each other. Whenever Tableau Prep isn’t able to identify a match, it provides null values under the unmatched columns. This happens with extra columns, misspelled column names, or incompatible data types.
Consider what may happen if the orange table from the previous example stayed the same, but the yellow table had the following changes (capitalization, different spellings, different words entirely):
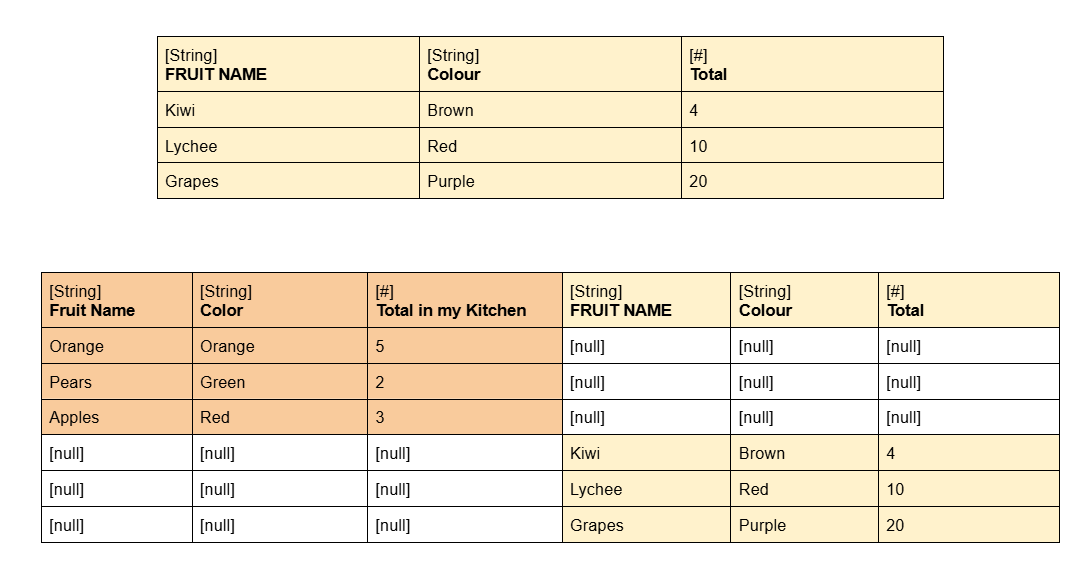
Tableau Prep can't recognize the columns as matches, so it keeps them separate and inserts null values instead. For this reason, double-checking your data manipulation steps is vital. Luckily, Tableau Prep provides a very intuitive and visual form of double-checking your work.
Creating Unions in Tableau Prep
One of the simplest ways to perform a union in Tableau Prep is to drag the second table on top of the first until more options appear, then hover over the Union option.
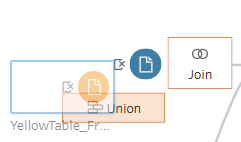
Alternatively, you can press the plus sign (+) next to your first table, select Add Union, and once the union step is created, drag your second table above it.
Tableau Prep also allows us to union multiple files at the same time, which is called a Wildcard Union. For further documentation, I’ll link this blog.
Reading Results
As mentioned before, Tableau Prep’s UI provides a very intuitive way of double checking your work. In your Union step, switch from the default Profile pane to either the Data Grid or List view (shown below). Tableau Prep then provides a summary of the union results. You might notice that Prep assigns one color to one table. In the below example, it's blue and yellow. On the right-hand corner of all the field names, you’ll notice that fields that contain rows from both tables have both colors. Any field that only contains values from one table will show only that color. You are also able to use the “Show only mismatched fields” checkbox to hone in only on those mismatched fields. (Note: Tableau Prep will also create a field called “Table Names” to distinguish between the two tables - that field has no attached colors.)
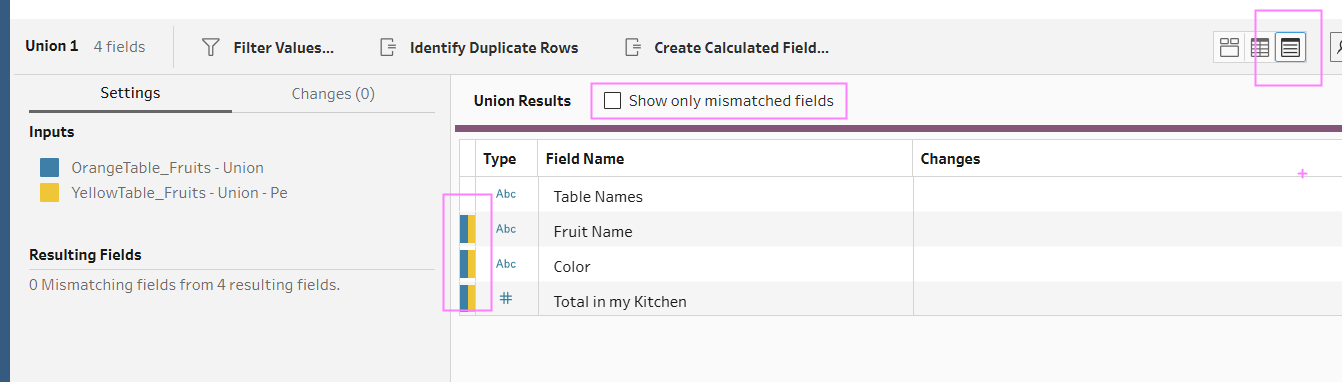
Once you get more comfortable with these visual cues, you’ll be able to notice these color cues even in the Profile Pane.
Fun fact: you might notice that the color line under “Union Results” is purple. That is because once you combine datasets via a union or a join, Tableau Prep assigns a different color to the new flow to indicate the combination of different data sources!
Joins
That purple marker became the first hint of what's coming next: joins use the same underlying idea of combining sources, but whereas unions stack data vertically, joins stitch it together horizontally, matching rows based on a common column rather than a shared column name. Same or similar rows are required, but the objective is to add more columns to a data set.
Joins also have a lot of great use-cases.Going back to why data gets split across tables in the first place, you might use a series of codes to refer to different store locations, but need to bring in the table that contains the names of your stores to understand why trends show up in certain locations (this secondary table is a Dimension table, specifically a Reference table; learn more about data structure here). Another use is fact-checking for data inconsistencies: an accounting department might join a table of actual employee expenses with a table of max allowable expenses.
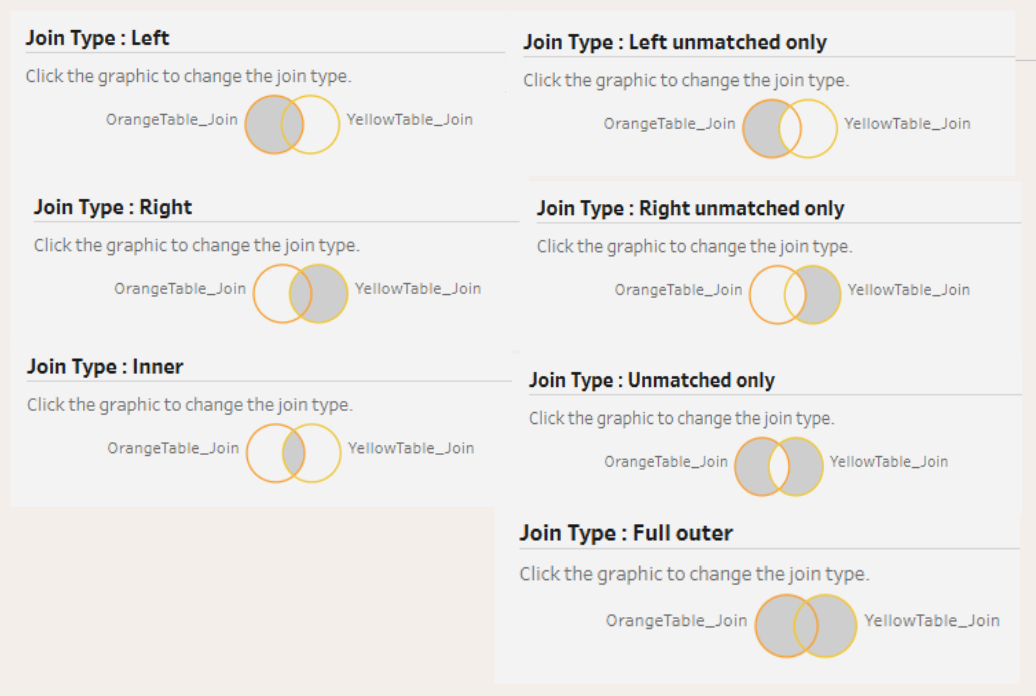
As mentioned above, a join requires at least one matching column - potentially more, depending on the complexity of the tables. This column, or columns, is called the join key. Not all rows in the join key columns have to match, but it matters which table's values you prioritize, since that changes your outcome. Tableau Prep offers us seven distinct join methods, shown below.
When you join two tables, one table is considered the “left” table and the other is considered the “right” table. For the purposes of this article, we will focus on the three most common joins: Left, Right, and Inner.
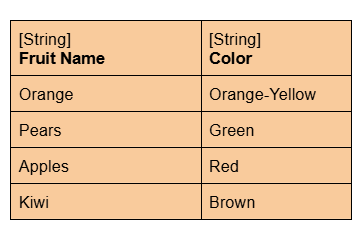
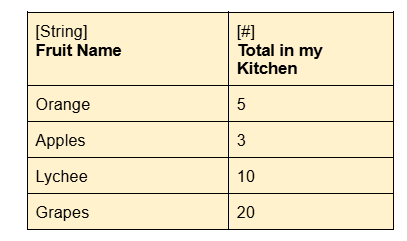
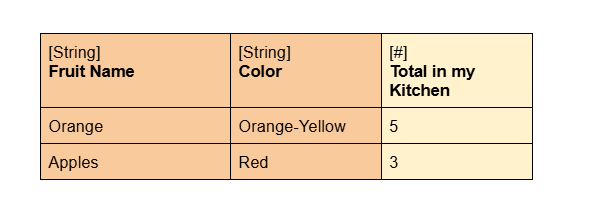
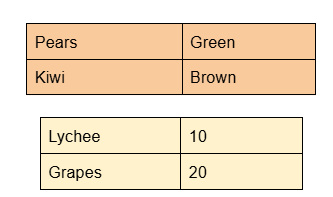
Let’s also consider the following as our two tables we’ll join. They both share the column Fruit Name (our join key) but notice how each has rows that don’t match rows in the other table. Orange table will be our “left” and the yellow table will be our “right” table.
Left Join
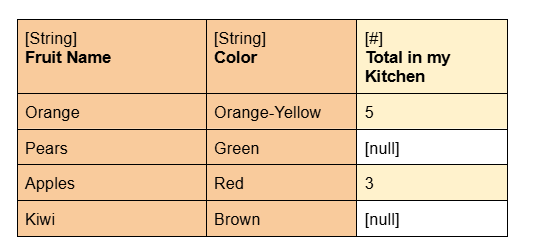
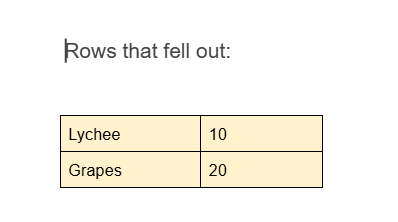
A left join tells Tableau Prep to keep all the rows that match material from the left table, and let any rows from the right table that don’t match fall out. In our example, the Lychee and Grapes rows from the yellow table don't match, so those rows are excluded entirely. Pears and Kiwis, though, do have rows, they just don't have a "Total in my Kitchen" value, so that field comes back null.
Right Join
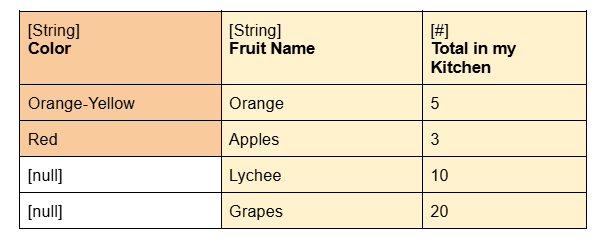
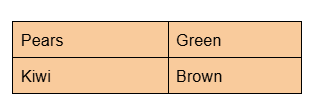
A right join works the same way in reverse: Tableau Prep keeps all rows from the right table, and lets unmatched rows from the left table fall out. Here, Pears and Kiwis don't exist in the yellow table, so they fall out completely. Lychee and Grapes exist in the yellow table but don't have "Color" values, so those come back null.
Inner Join
The inner join is a mix of the two above: it keeps only the rows that match both the left and right tables. Our final table ends up looking like this:

Creating Joins in Tableau Prep
The first step to making a join looks the same as making a union. Drag the second table on top of the first until more options appear, then hover over the Join option (You can also use the Add Join option).

The difference comes in the configuration. Tableau Prep will automatically create an inner join (if it recognizes your join key), but different joins are necessary in different contexts. A look at the configuration pane will help us create the join we need.
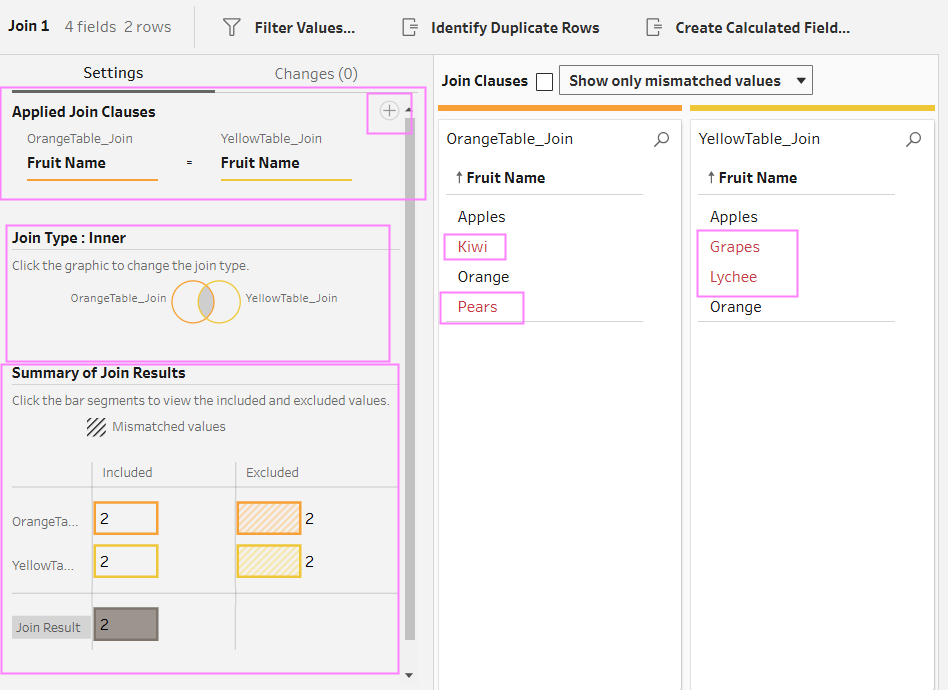
In the settings, you can specify the join clauses. Tableau Prep recognized ours automatically, but it won't always. Below that, you can choose from 7 join types by clicking on parts of the circles. Below that, you’ll be able to see a summary of what rows are included and excluded from the join results. Because we set our join to inner join, you might remember 2 rows of each data set will fall out.
To the right of the join settings, Tableau Prep gives you a detailed view of which values don’t match the other table.Note: the Join Results and the left-hand Join Summary change depending on which join you pick, but the detailed mismatch view stays static. It's meant for closer diagnostics. Finally, let's look at the results pane, to the right of everything above.
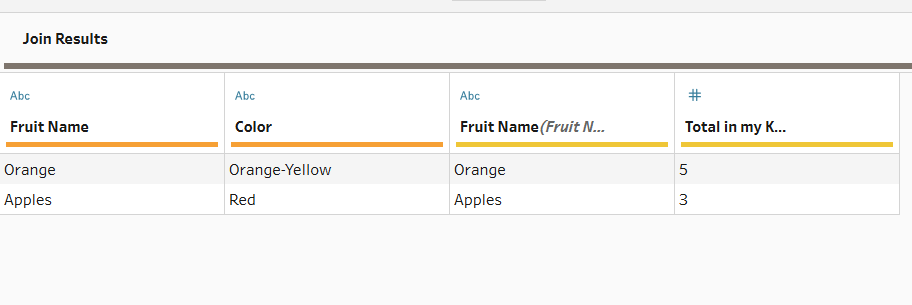
This is the overall result of your join. Notice that Tableau Prep kept the original table colors under the column name for quick analysis. Notice too that Tableau Prep keeps both join key columns automatically; you'll need to delete one to avoid a duplicate.
A Quick Note on Tableau Public/Desktop Relationships
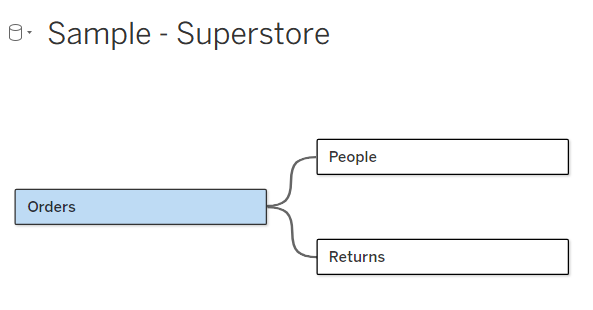
Tableau Desktop offers a third way to combine tables: relationships. Unlike joins, relationships don't merge your data into one physical table right away. Instead, they keep each table at its native grain and only combine rows at the level of detail your view calls for.
That flexibility has tradeoffs. Since relationships calculate on the fly instead of upfront, they're harder to debug when something looks off, you often have to dig into the underlying queries Tableau generates. Relationships also don't fully replace joins: you'll still need one for filtering, blending at a different grain, or row-level control a relationship can't give you. Worth knowing what they solve and where they fall short as you move from Prep into Desktop.
Conclusion
Joins and unions are two of the most foundational tools in an analyst's toolkit. Mastering them isn't about memorizing which button to click, it's about understanding the shape of your data and what question you're actually trying to answer. Unions stack similar data together for the fuller picture. Joins connect related data across tables to fill in details or catch inconsistencies you'd otherwise miss. Both come down to paying attention to granularity, matching fields, and what happens to the rows that don't line up.
The good news: Tableau Prep's visual interface makes double-checking your work intuitive instead of tedious. Color-coded results, mismatched field indicators, data grid views, you can see exactly how your data came together, row by row. The more you work with these tools, the more that visual feedback becomes second nature, until you're reaching for the right technique before you even open the canvas.
–Adapted from material used to teach the general public in July 2026.