Over the last weeks we had timeslots here and there to work on a personal project.
We were free to chose what the topic was and which tools we use.
As I am an information hungry person, my topic of choice was something with Wikipedia.
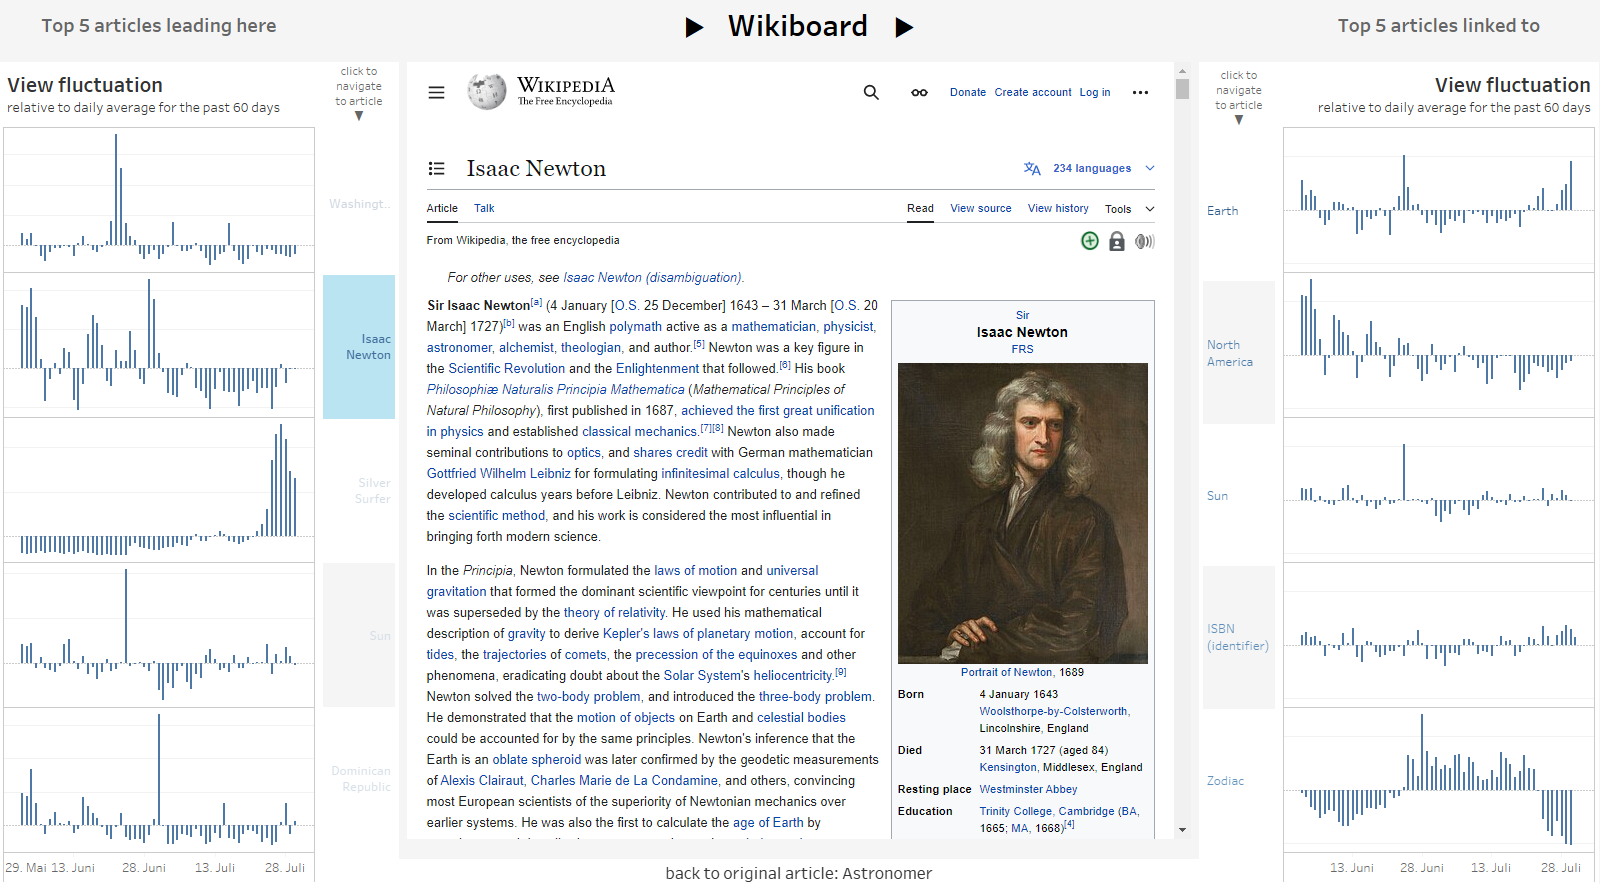
The general idea was to see roughly to which topic an article is connected to while reading it.
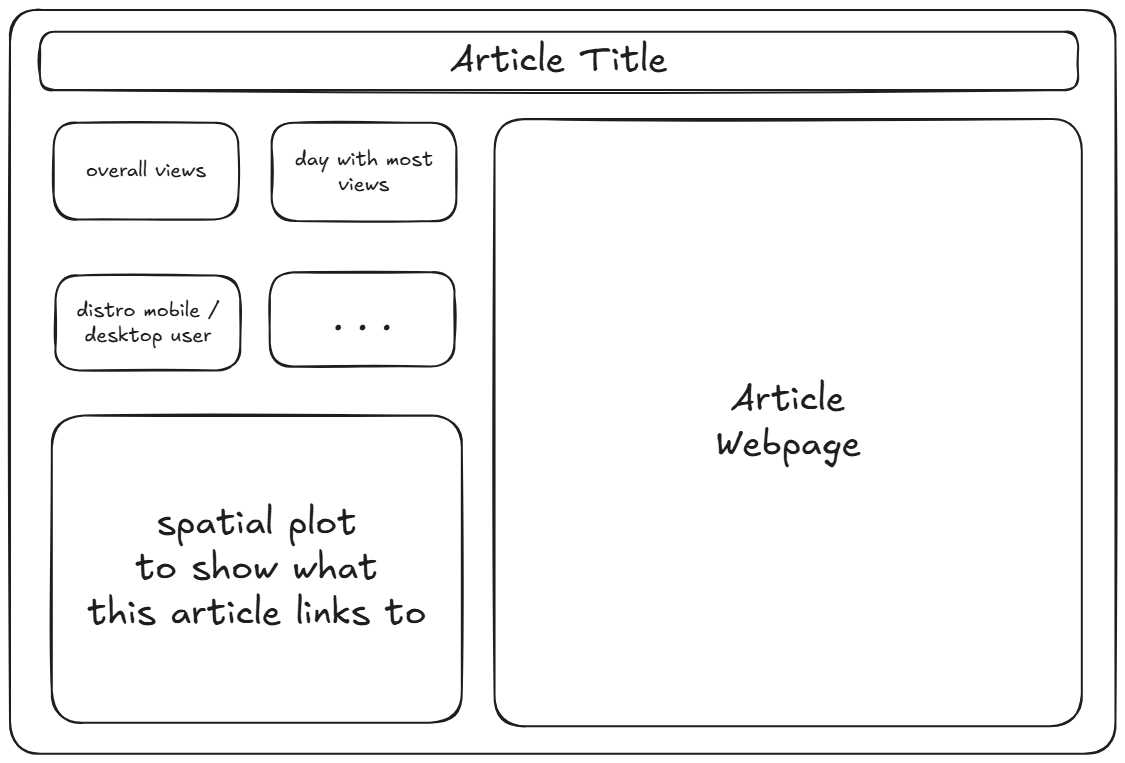
sketch of my first dashboard idea.
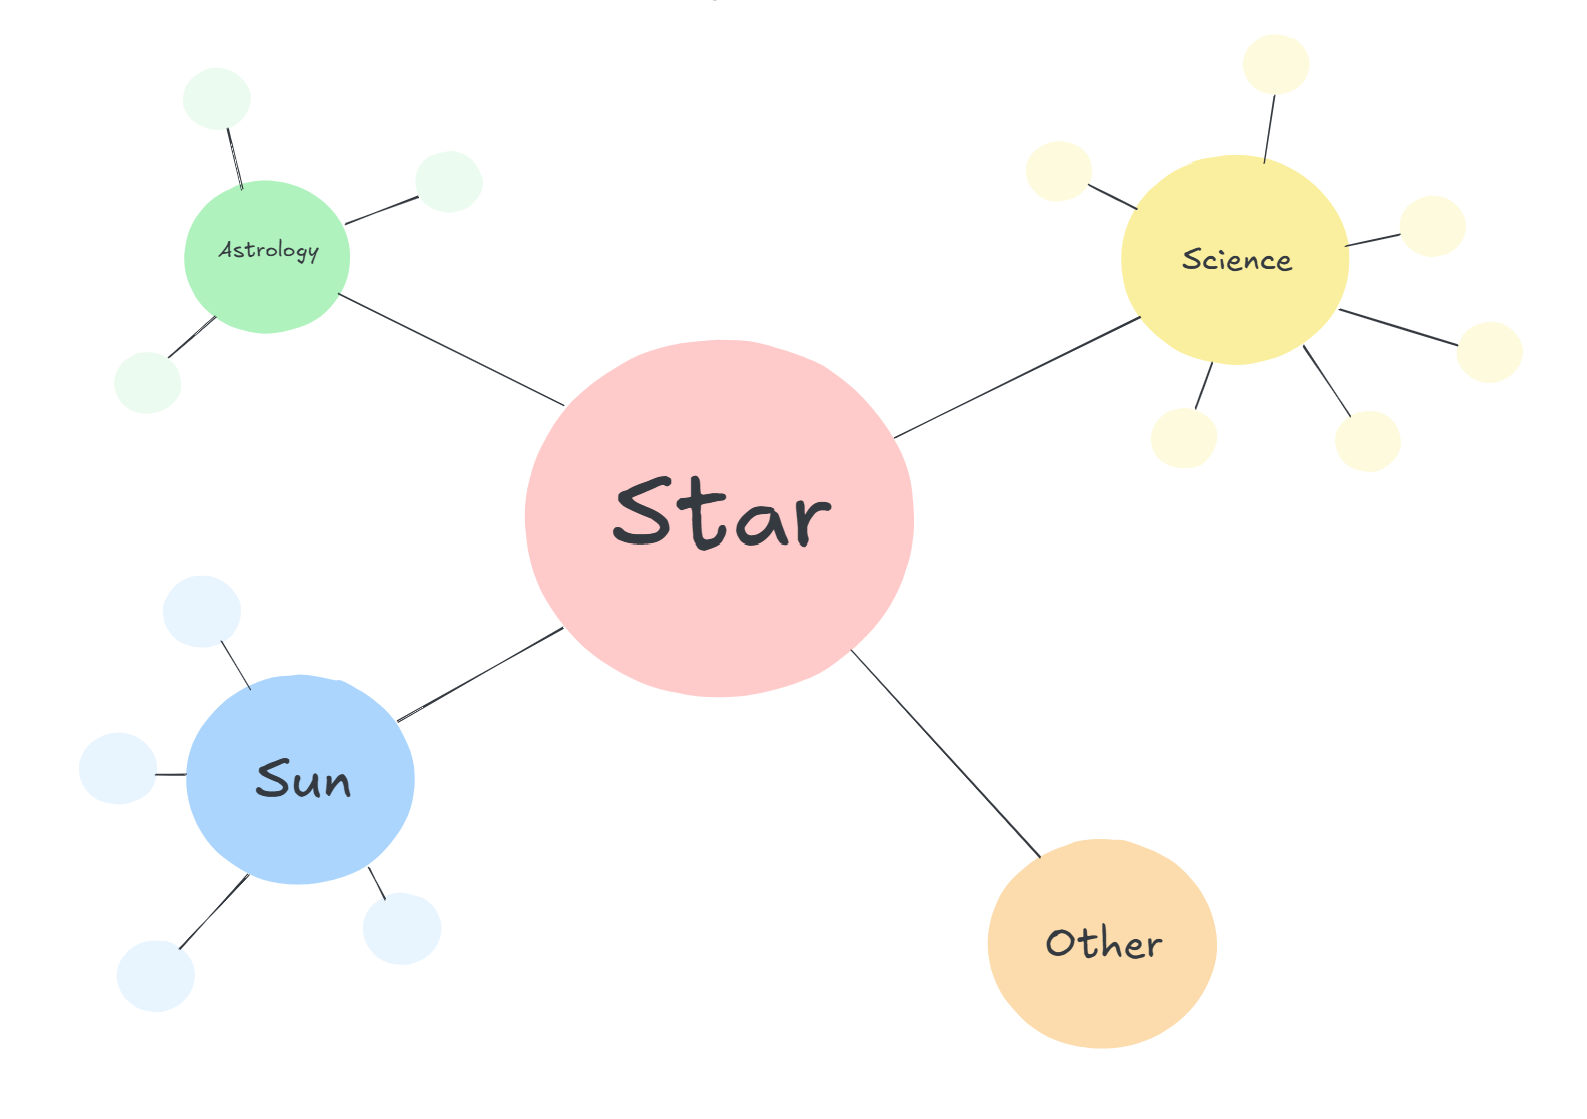
Sketch of how the connected topics could be visualized.
To gather the neccessary data, I had to wrap my head around how to call the wikimedia API.
Here It is explained:
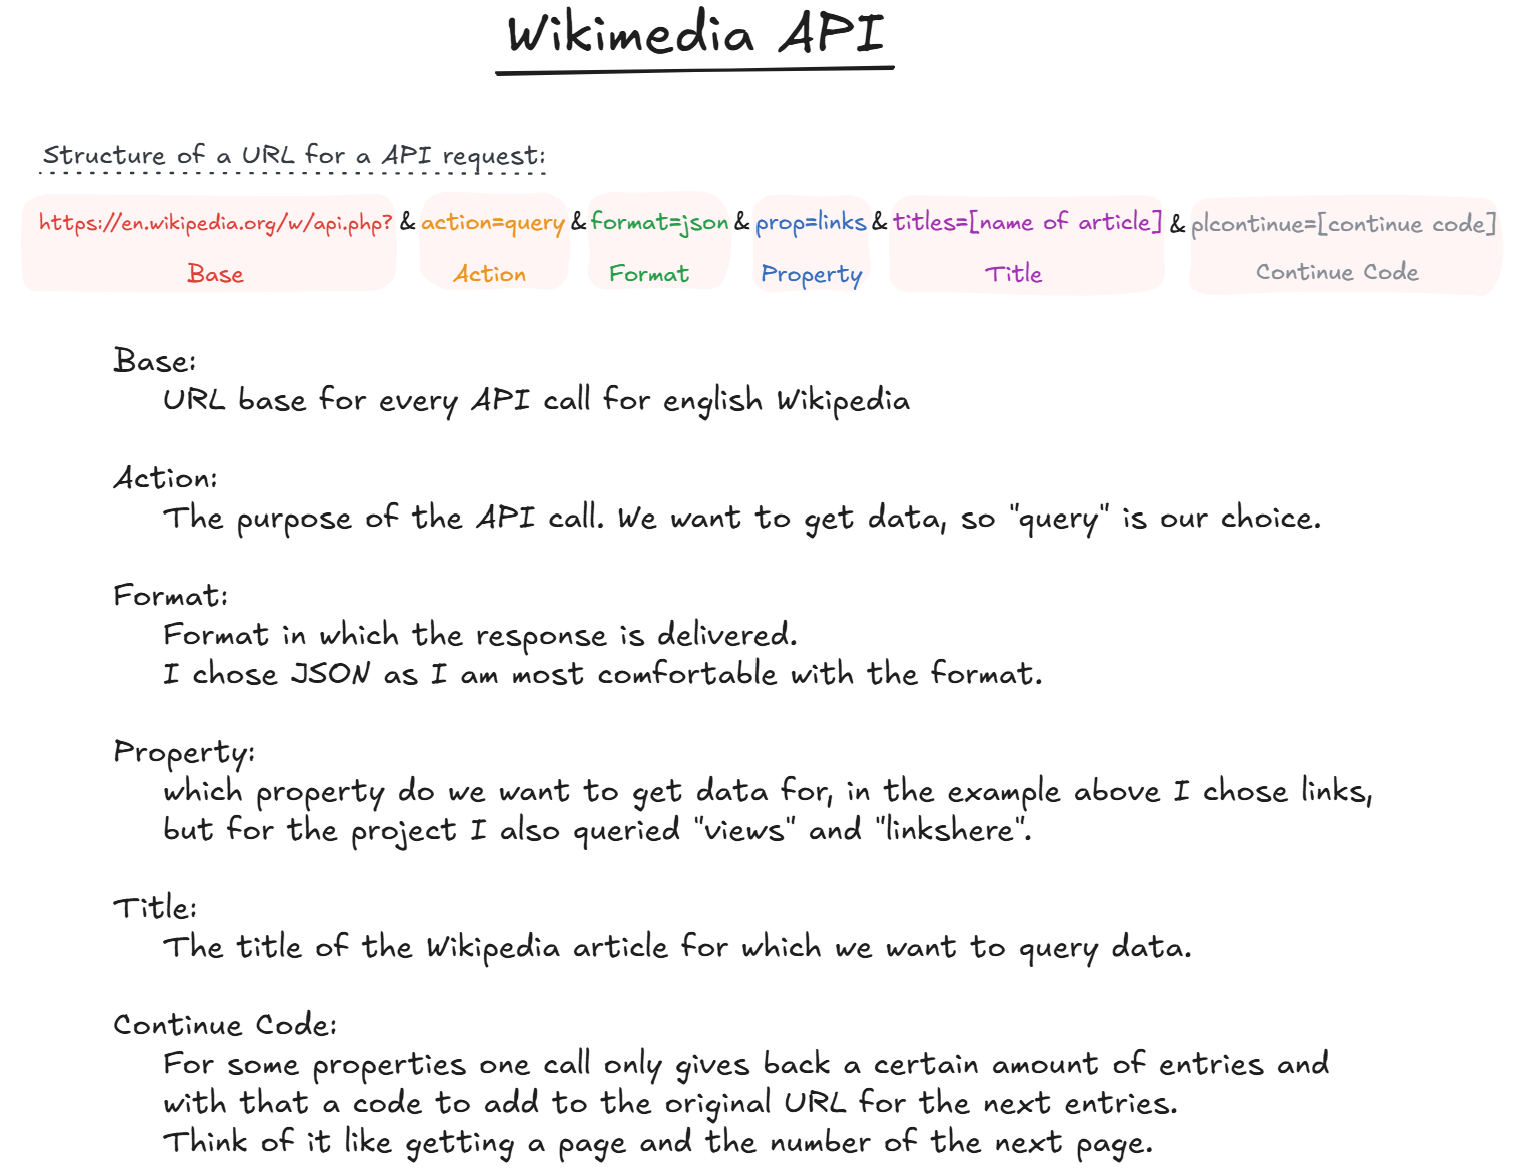
Wikimedia API description
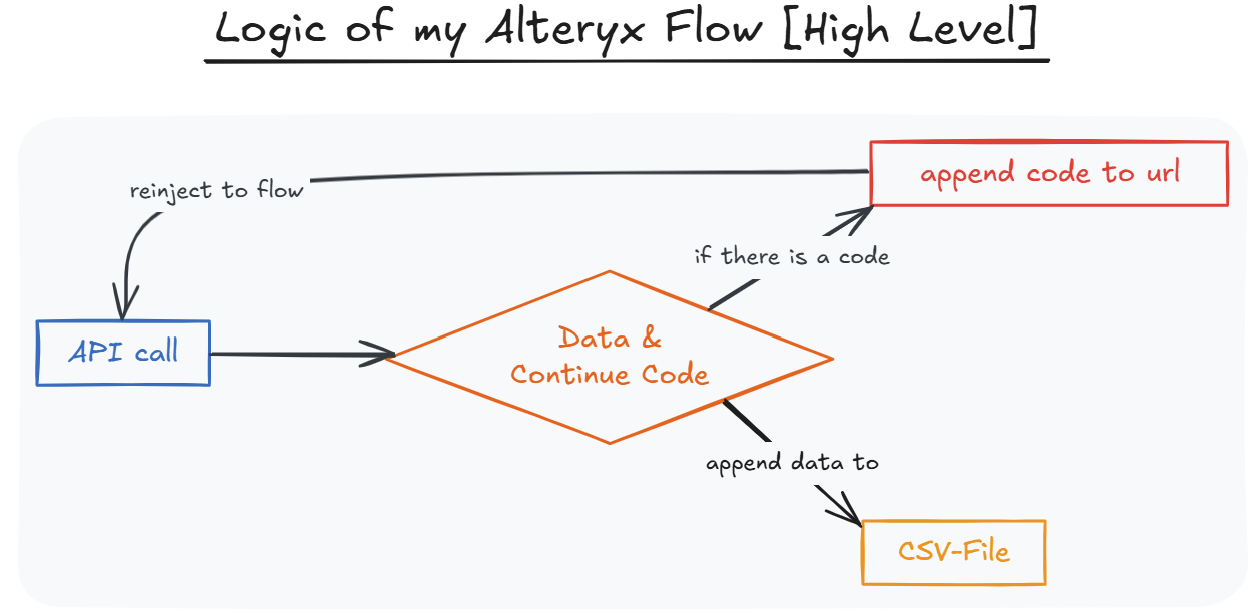
To get this data, I created an Alteryx flow.
Here is a sketch of how it is logical structured:
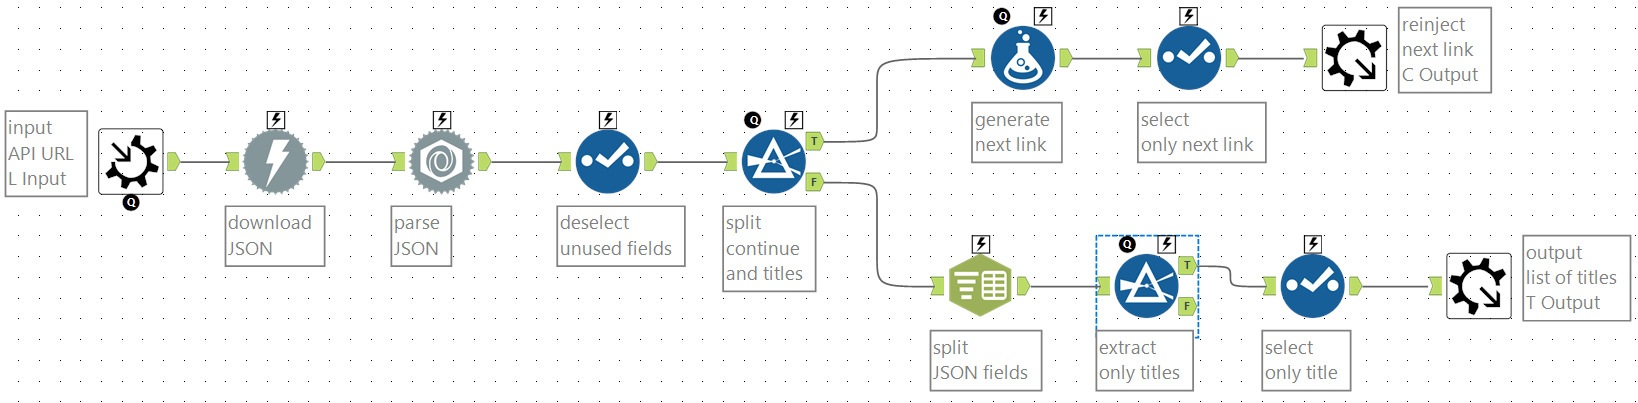
And here is the actual flow:
First version of the dashboard I like to iterate on: