


When you make your chart dynamic, meaning it can move when you click on a section of the graph, it might highlight the section that you have clicked on. This could obscure everything else on the graph. Follow along if you want to get rid of this feature.

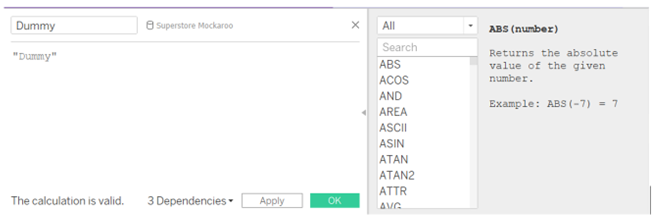
This can be amend in two ways. In both ways a 'dummy' field needs to be created. This is created in a calculated field and can be either the number 1, which returns an integer, or a single word such as "Dummy" which returns a string. This needs to be done to return a value of one, and both of these calculations need to be a discrete measure meaning it is not automatically aggregated. In this example I chose the word "Dummy" and because this returns the value as a string, and because it is a string it does not need to be changed to a discrete measure.
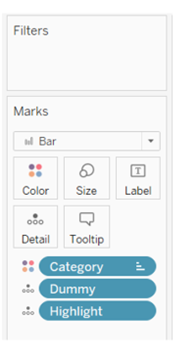
You then need to put the Dummy calculation onto 'detail' on the marks card.
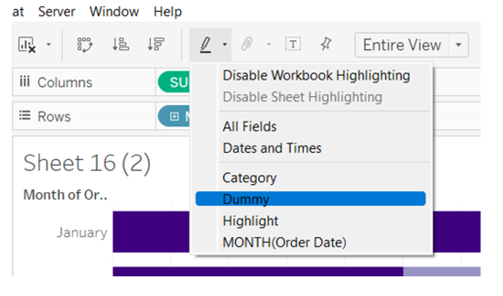
Once it is on the marks card, the first method is to use the highlight icon on the top row (it slightly looks like a pen). From the drop down menu of the highlight icon you select your 'Dummy' field and the problem is no longer there.
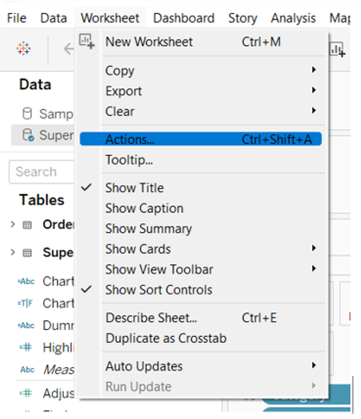
The second option is to use an action on your worksheet. This will still need to have the 'Dummy' field on detail.
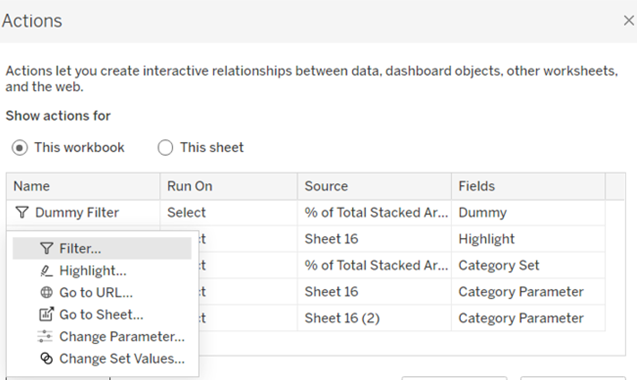
Choose the 'Filter' option.
Name the filter as the dummy filter and set up the filter like it is below and by selecting the dummy filter.
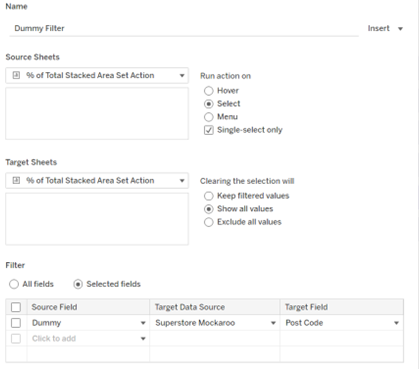
After setting this up, the highlight will be gone.