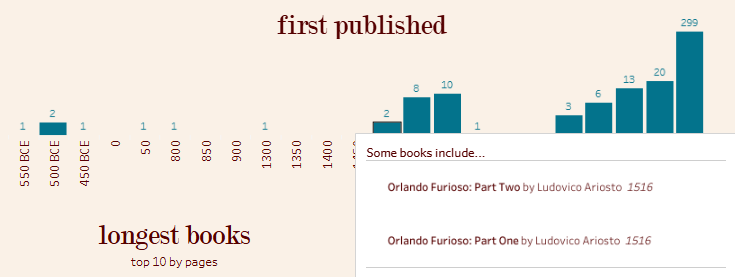
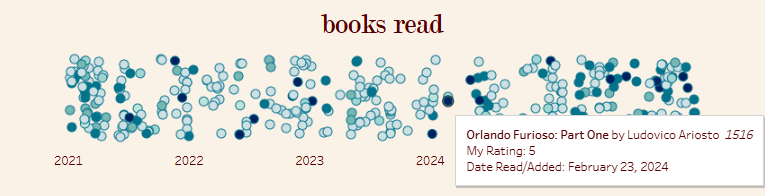
I've been tracking my books on goodreads for years now and always look forward to the end of the year when you receive a summary of how many books and pages you've read. Taking inspiration from this I wanted to look how my reading trends across multiple years as well as dive deeper into exploring the types of books I'm reading.
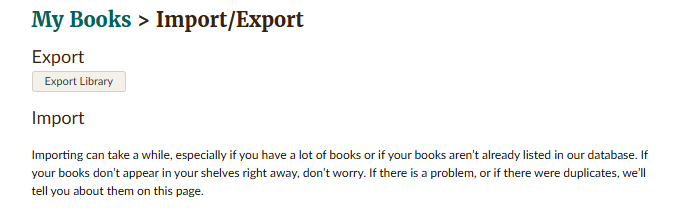
Goodreads allows you to export your books with information about the bookshelf, review, rating, date read/added, author, and more. However the information, particularly about the books is not comprehensive and is missing several fields that I am interested in.
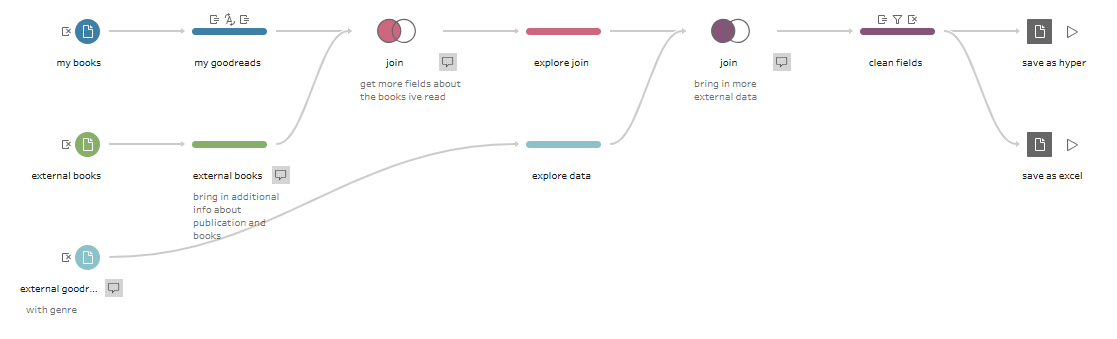
In order to bring in additional information about genre, date first published, descriptions, settings, and book covers, I joined my books data with two external datasets that included more information about lots of books. This allowed me to match more than 85% of the books I read and get the additional information I was looking for.


Using Tableau prep I then created a simple flow to join and prepare this data in order to build a dashboard and explore my books more visually.
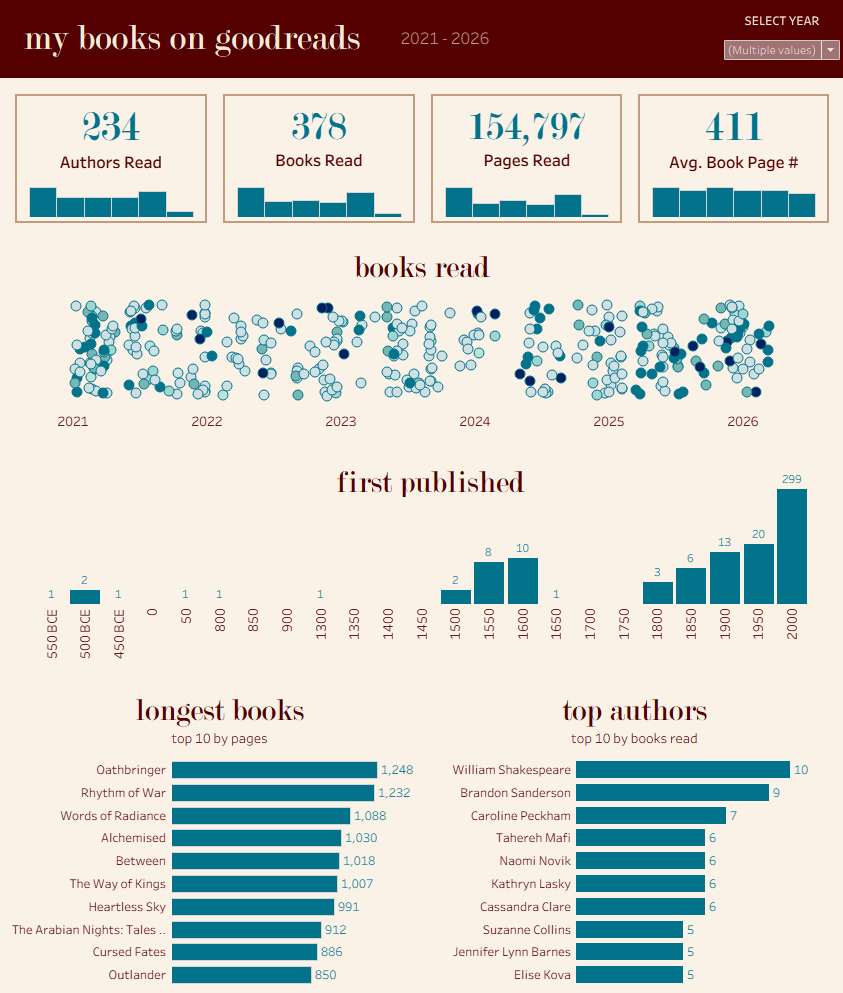
While I only ended up including in my dashboard a few of the many charts I built, I was able to learn so much about what I read and how that has changed over time.
While my final dashboard only features a fraction of the charts I built, the process offered deep insights into my reading habits and how they’ve evolved. In designing the interface, I leaned into a minimalist aesthetic; since this was for personal use, I chose 'curated obscurity' over information density. If I were building this for a wider audience, I’d prioritize clarity and context. For now, however, I’m enjoying the sense of mystery and discovery that an ambiguous dashboard invites.