


Let's say we wanted to use Tableau's Sample Superstore dataset to answer the question: how many product sub-categories are profitable in Canada?
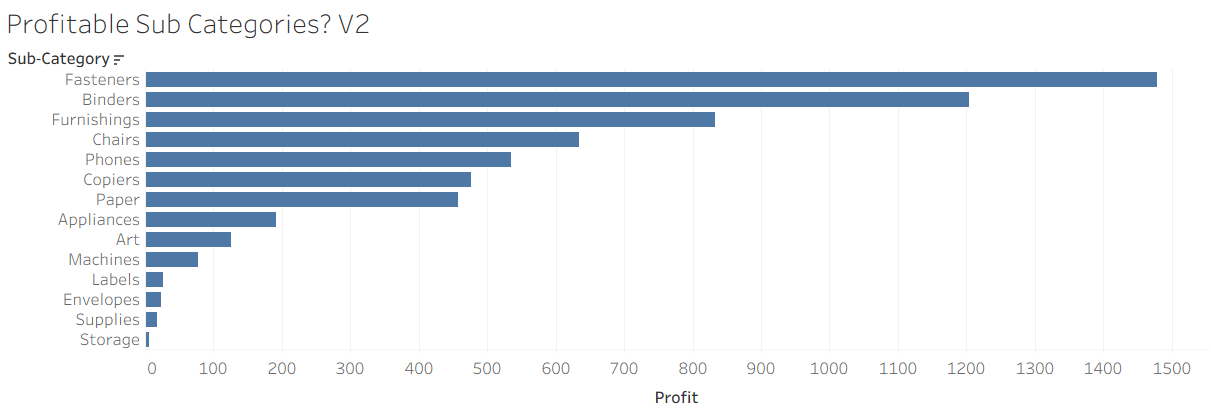
A bar chart might be a good first chart to build. Dragging Sub-Category to rows, SUM(Profit) to columns, filtering Country/Region to leave just Canada and sorting by SUM(Profit) would yield a viz. like the one below.
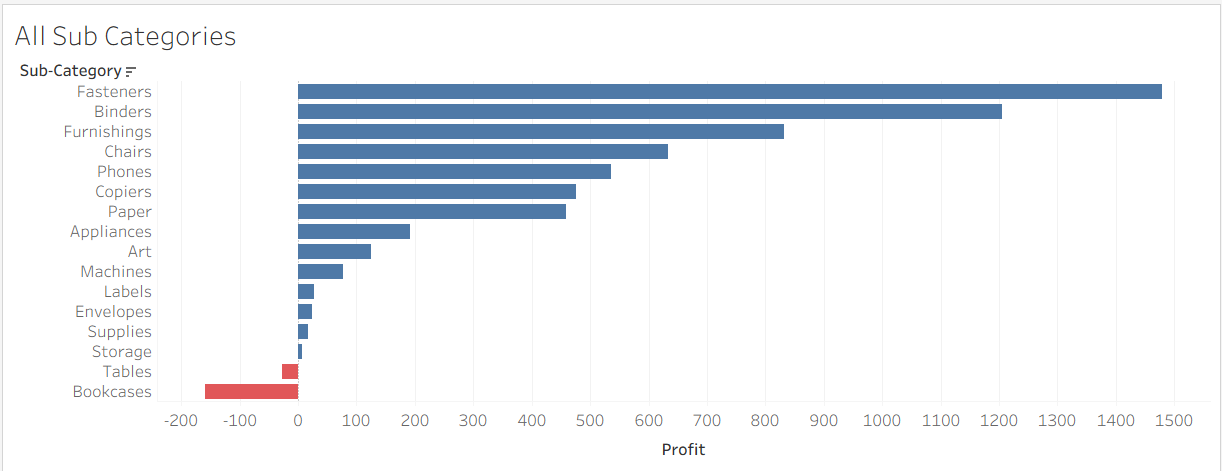
We see that of the 16 sub-categories of products sold in Canada, 14 are profitable.
But what if we wanted to only keep the profitable sub-categories? We'd need to filter by SUM(Profit) > 0, but this can be done in a few ways.
One way would be to filter using the Sub-Category field. Dragging Sub-Category to the filters pane and inputting the following condition into the dialogue box -
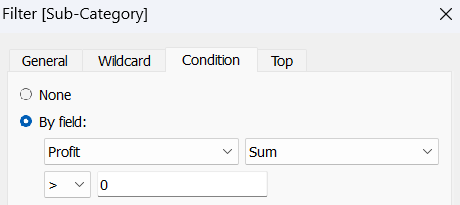
- allows us to keep only the profitable sub-categories, right?
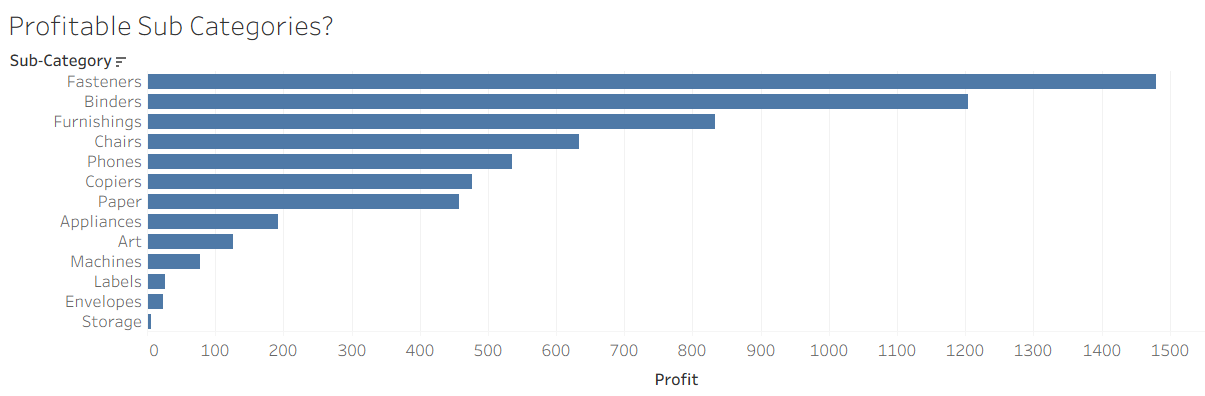
But the resulting viz. only shows 13 profitable sub-categories. Where has the 'Supplies' sub-category disappeared to?
Instead of using the Sub-Category field to filter, we could have directly filtered using the Profit field. Dragging Profit to the filters pane, choosing 'Sum' for aggregation and filtering to only keep sub-categories with a profit of at least 0 -
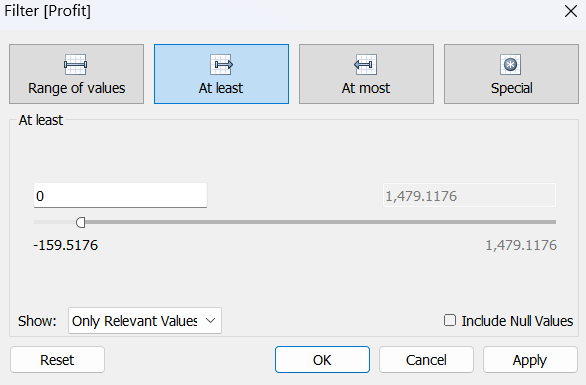
- results in the following viz:
'Supplies' is back and we see 14 profitable sub-categories, again. But why does filtering for the same condition in two different ways yield two different answers? The answer lies in Tableau's Order of Operations.
Tableau's order of operations refers to the sequence in which it applies filters and calculations to generate a visualisation.
It's a bit like BIDMAS - or whatever acronym you were told at school while learning arithmetic. 8 + 2 × 3 is 14, and not 30, because multiplication happens before addition.
Similarly, Tableau has a particular order in which is applies filters and calculations, and not knowing that order can result in incorrect results.
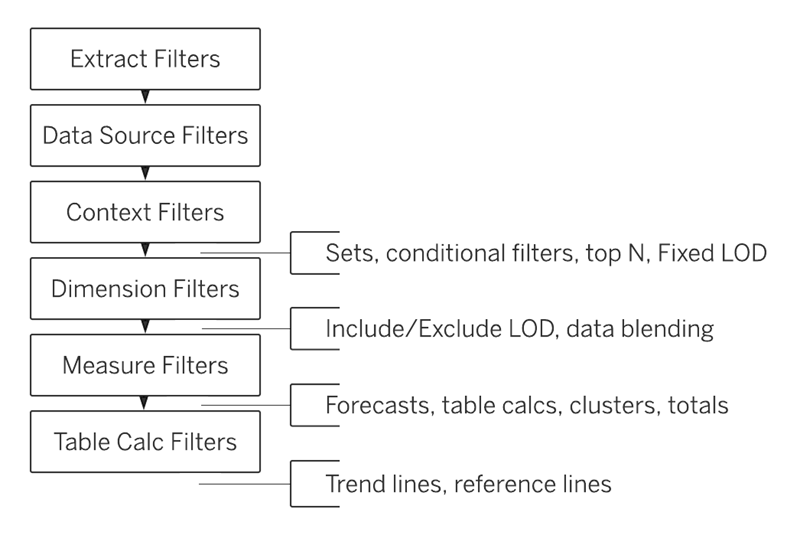
So, let's use Tableau's order of operations to make sense of why we got two different results to our question. From the image above, we see that conditional filters happen before dimension filters. And so, when we tried to make our bar chart using the condition SUM(Profit) > 0 via the Sub-category field, (1), the conditional filter executed before the dimension filter, i.e., before only Canada was filtered for. As Sample Superstore contains data on the U.S. as well as Canada, and because the 'Supplies' sub-category is not profitable when including orders from both the U.S. and Canada, 'Supplies' was dropped from the view. The subsequent dimension filter only retains Canada's portion of the sub-categories that are profitable overall.
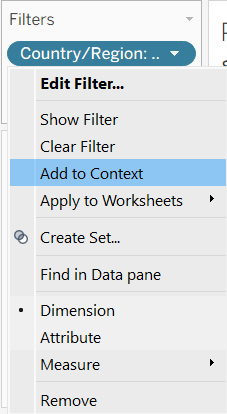
But surely there must be a way to tell Tableau to apply the dimension filter before the conditional one? There is - and that's where context filters come in. From the image above, we see that context filters happen before conditional filters. A dimension filter can be made into a context filter by clicking on the arrow next to the pill in the filter pane and selecting 'Add to Context'.
Doing so filters the dimension first. In our case, filtering for only Canada before we filter for the condition: SUM(Profit) > 0. Adding the filter to context results in the correct answer - 14 profitable sub-categories.
But why did filtering using the Profit field, (2), result in the correct answer immediately? Because dimension filters happen before measure filters. Thus, Canada was filtered for first, and only then were the profitable sub-categories filtered for.
Takeaway
As in arithmetic, Tableau follows a sequence. Filters are evaluated at different stages of that sequence depending on their type, and that difference can change the result. Understanding the order of operations is what turns unexpected answers into predictable ones.