Last day of dashboard week, and a massive change of pace from yesterday.
Today, we were given Goodreads data between 2006 and 2017. We were given two tables: a books table, containing data on the books that were on the site, and a table containing reviews for all the books.
As a reader and philosophy enthusiast, I immediately had ideas for what I wanted to focus on. I wanted to focus on the philosophy books on the site, i.e., to determine whether readers rated these books in a different way to other books, whether they took longer to read them, etc.
Unfortunately, the readers of Goodreads didn't share my interest in philosophy. Though there was a genre field in the book table, the field was all but useless. A friend in my cohort found a book labelled as a fictional biography...
Nor did filtering the dataset to books written by some of the big names in philosophy yield more than a few dozen books. No Nietzsche, Kant, Aristotle, Heidegger - even Marx was nowhere to be found!
After spending about an hour and a half planning and tinkering, I was forced to ditch my plan.
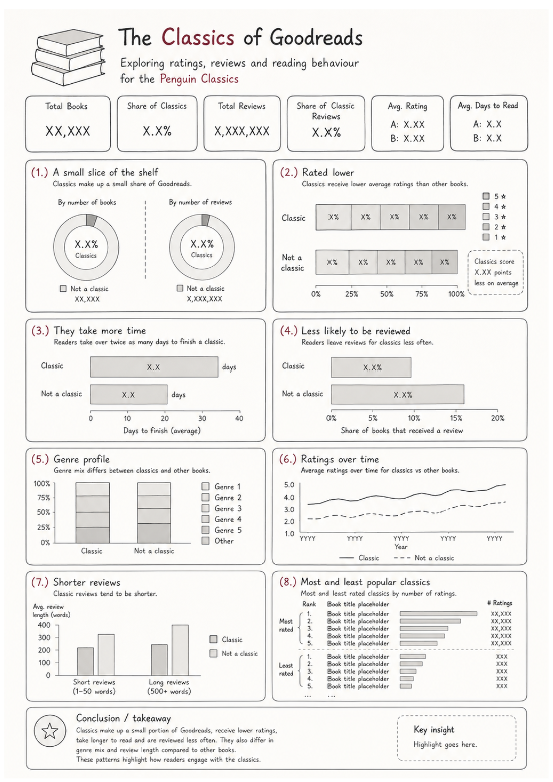
Fortunately, I remembered the old adage - read old books. Half of the books on my bookshelf have the Penguin logo, and nearly all of these have either a black or greyish white cover. Penguin's Classics and Modern Classics are some of the best books ever written. I decided to make a dashboard comparing readers' reception to the Penguin Classics/Modern Classics tradition with the rest of the Goodreads dataset.
I created a lookup table of authors that have a Classic or Modern Classic published, joined this onto Goodreads' books table, and created a flag to indicate whether a book was written by one of these authors.
This method had the issue of flagging all of a matched author's books as a 'classic,' not only the titles actually published by Penguin. Given the time constraints, this was a bullet that had to be bitten.
Below is a sketch of the dashboard. The finished dashboard will be on my Tableau Public soon.