


Today we were tasked with using an API and scraping the redlist endangered animals website. The animals I chose for today were all landlocked carnivorous mammals that were considered critically endangered.
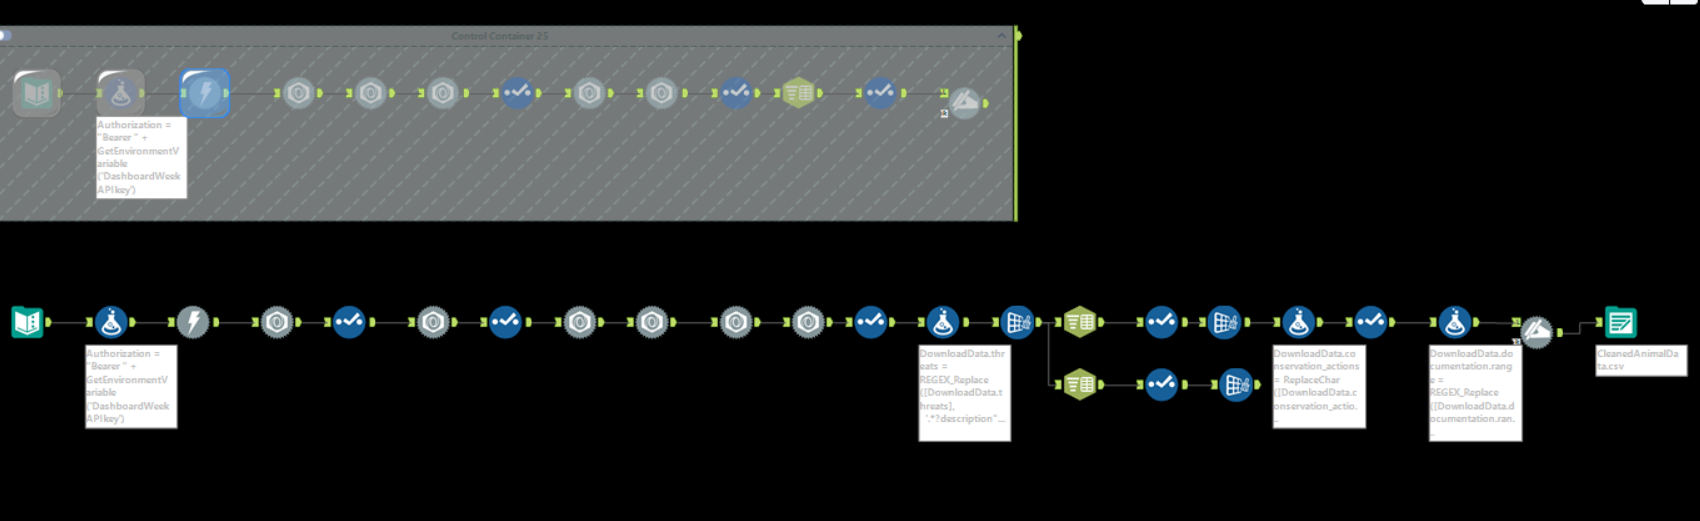
The first thing I did was register my API key as an environmental variable, and then filtering for the exact animals I wanted. From there I used a variety of JSON parse tools and REGEX in order to fully clean my data.
I was then able to bring my data into Tableau, where I created an infographic style dashboard as sketched below.
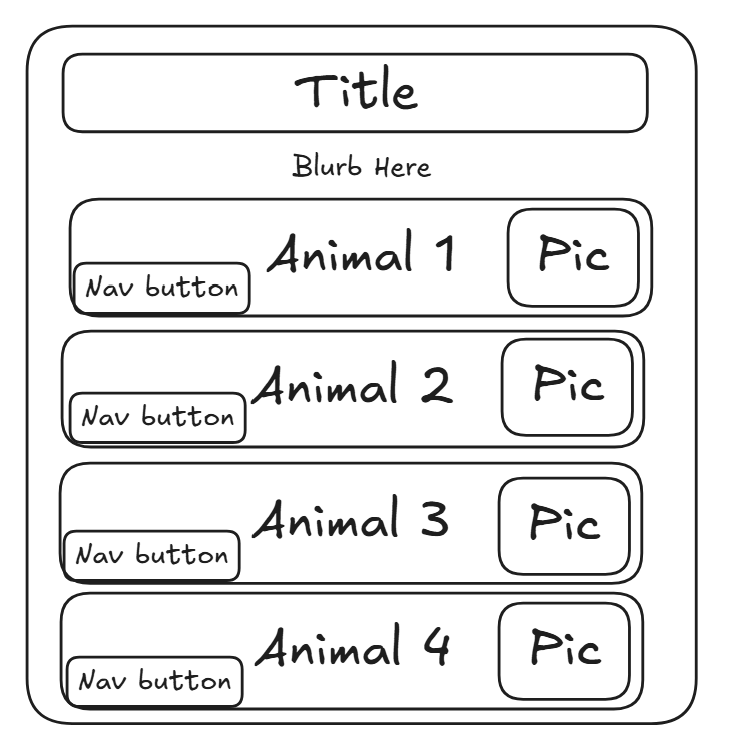
I then spent the better half of the next 2-3 hours creating my infographic, where I ran into a few blockers such as HTML artifacts left in my text, or formatting errors in Tableau. I ended up with a finished product that I quite proud of, given the time frame of today's project.