


Today was the day I found most difficult. We were tasked with web scrapping the cocktails database. This is a topic I found quite challenging as I struggle quite a bit with APIs.
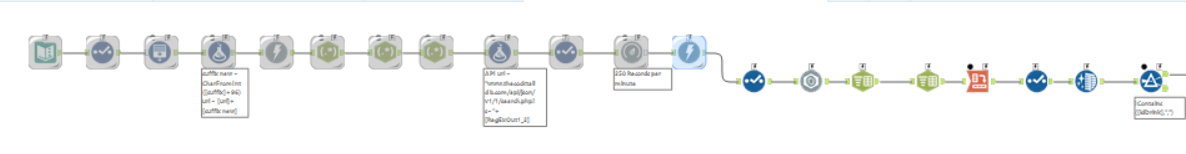
We started off by looking through the website and I read over some blogs to refamiliarise myself with the topic. We then got started on web scrapping. I initially used an API to get data from the website however this contained only 25 rows of data. This is when I realised I had to web scrape instead. The process itself took me a very long time as I ran into multiple roadblocks. Initially I tried to use a batch macro but this would only leave me with data from one letter of the alphabet. Eventually I managed to get the data required from the website. I had to use regex which I believe was something that went well during this process. However I forgot to cache and run which led to a very long wait time for the workbook to run. My final workflow looked as follows:
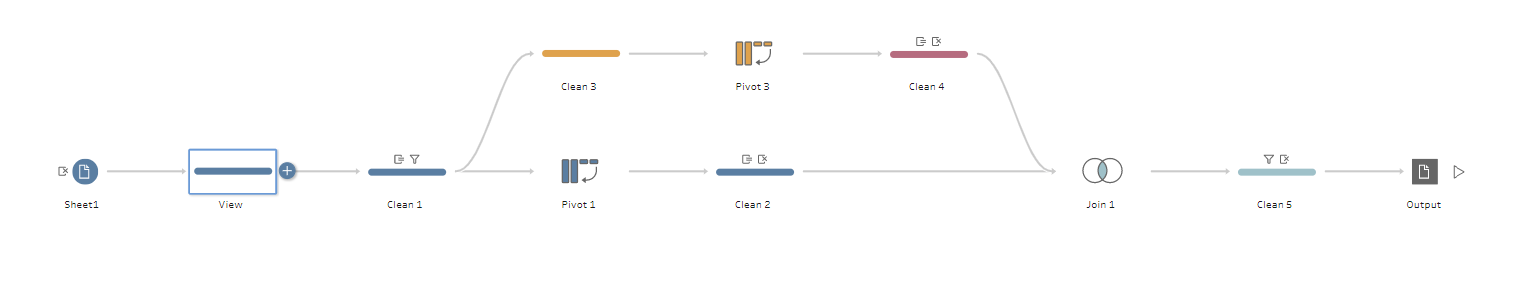
The next step was to create a dashboard using the data. However when I looked at the data I realised I needed to do a little bit more data prep. I brought my data into prep and filtered to gin cocktails only. Then I had to pivot the data and remove unnecessary fields so I created the following flow:
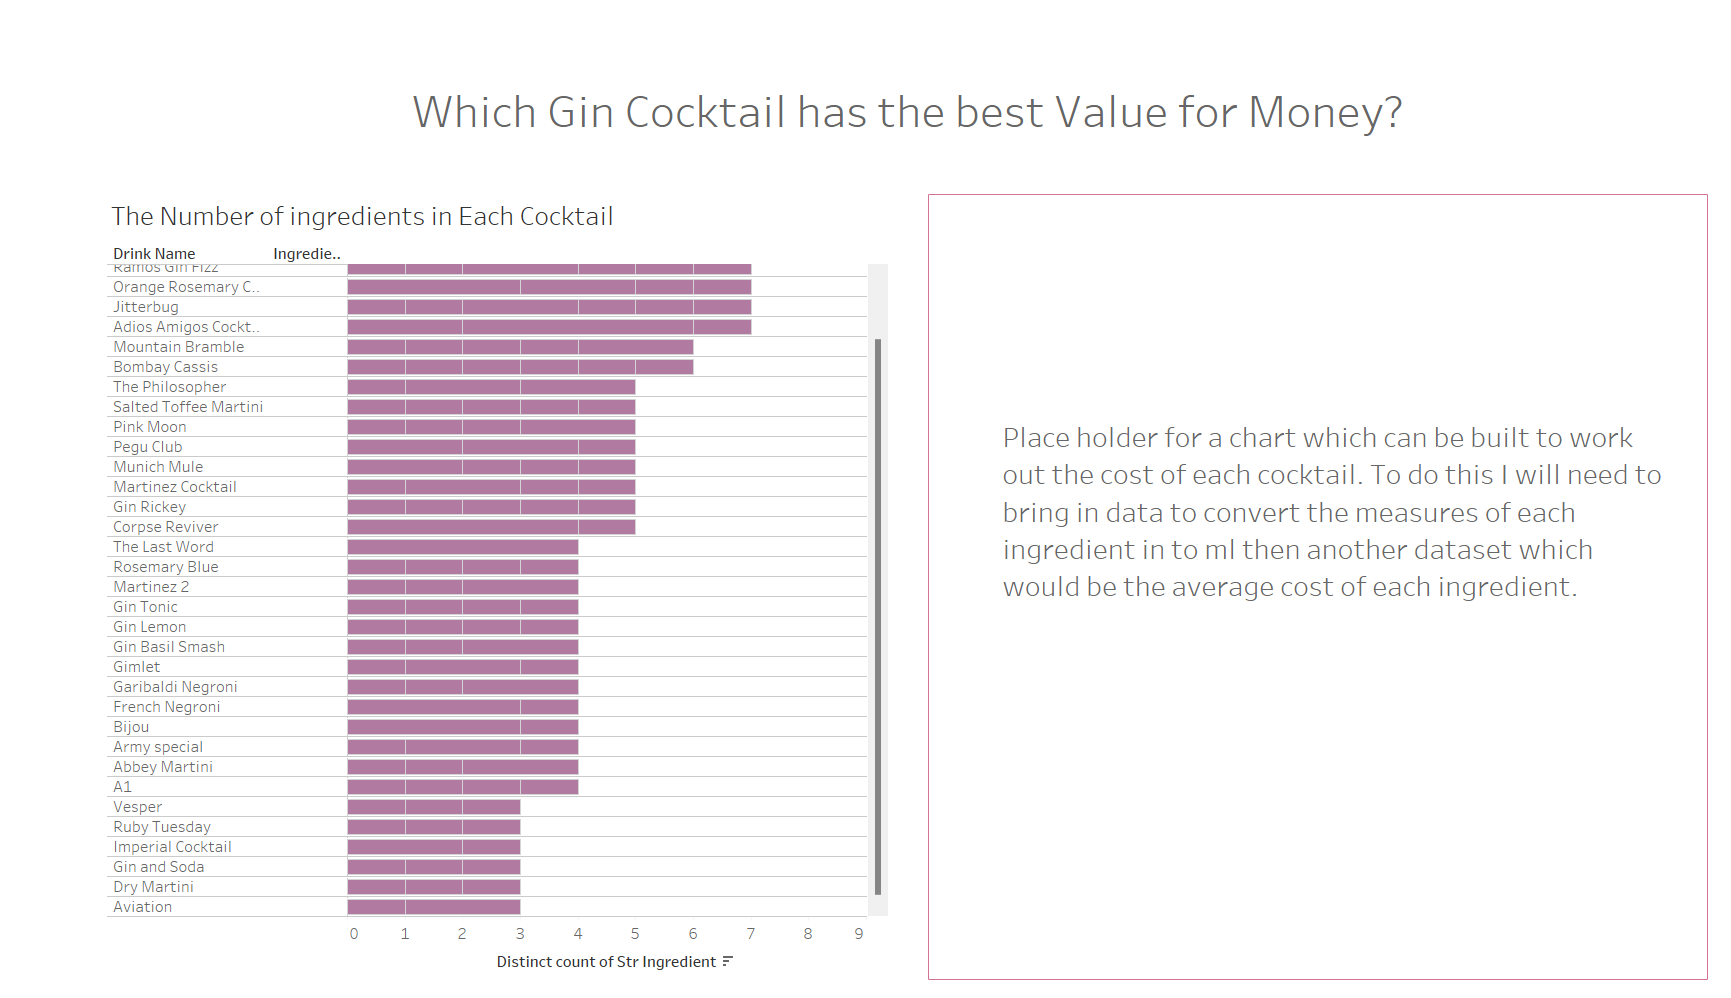
I struggled to find a story for my dashboard and due to limited time I couldn't bring in extra data to work out the cost of each cocktail. I left a placeholder for that chart so that I can pick up where I left off when I have time.
I also created a more fun dashboard:
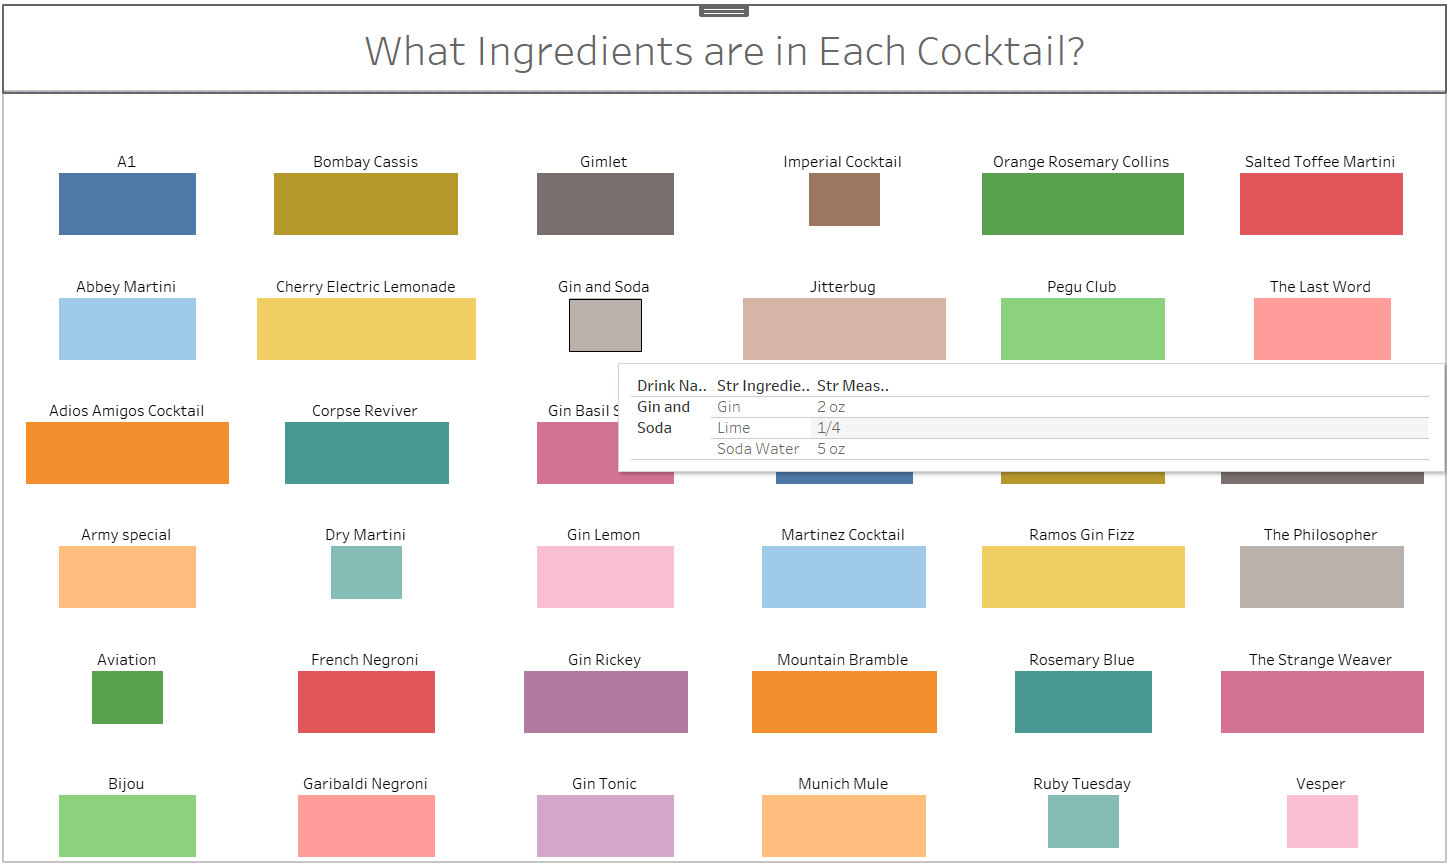
The size of the bars represent how many ingredients are in each cocktail with the tool tips containing information on the ingredients and measurements for each cocktail.
Overall I found this task quite challenging however I found it useful for learning more about Alteryx. A challenging end to dashboard week and training: I look forward to working on my dashboard further.