


For day 2 of Dashboard week we started our two day task of the tableau data+ movies challenge. The dataset we originally started with had over 5 million rows. I started off by familiarising myself with the data dictionary. I uploaded the data onto Alteryx while I completed my data discovery. I decided to make my project about Tamil language films, as a native Tamil speaker who grew up watching Tamil Language films, I was very exited to start the project.
I started by writing my user story:
<As A> producer in Tamil cinema
<When I> compare the IMDB ratings over time
<I want to> identify the components of a successful and how it changed over time
<So I can> make a successful film.
This led me to the following plan for my dashboard:
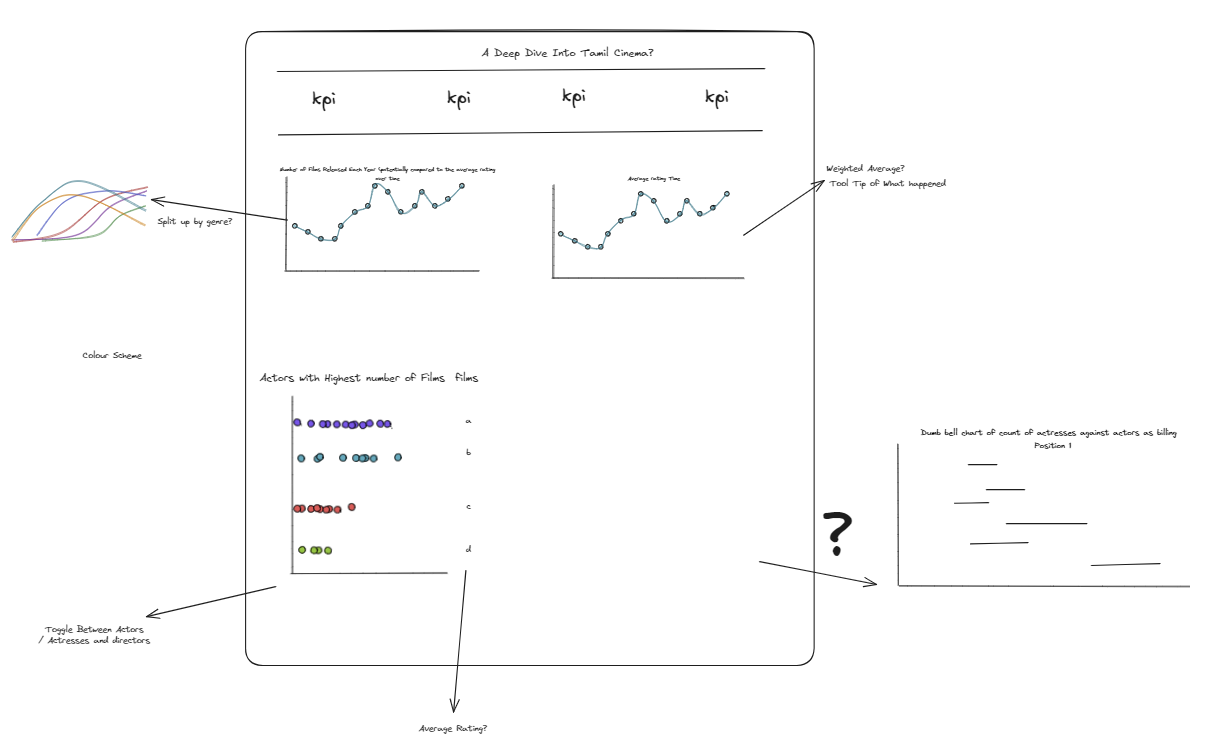
My plan was very vague so I decided to start building charts on Tableau to see if I identify any trends which may change the trajectory of my story. After spending some time building my charts, I reworked my plan to look like:
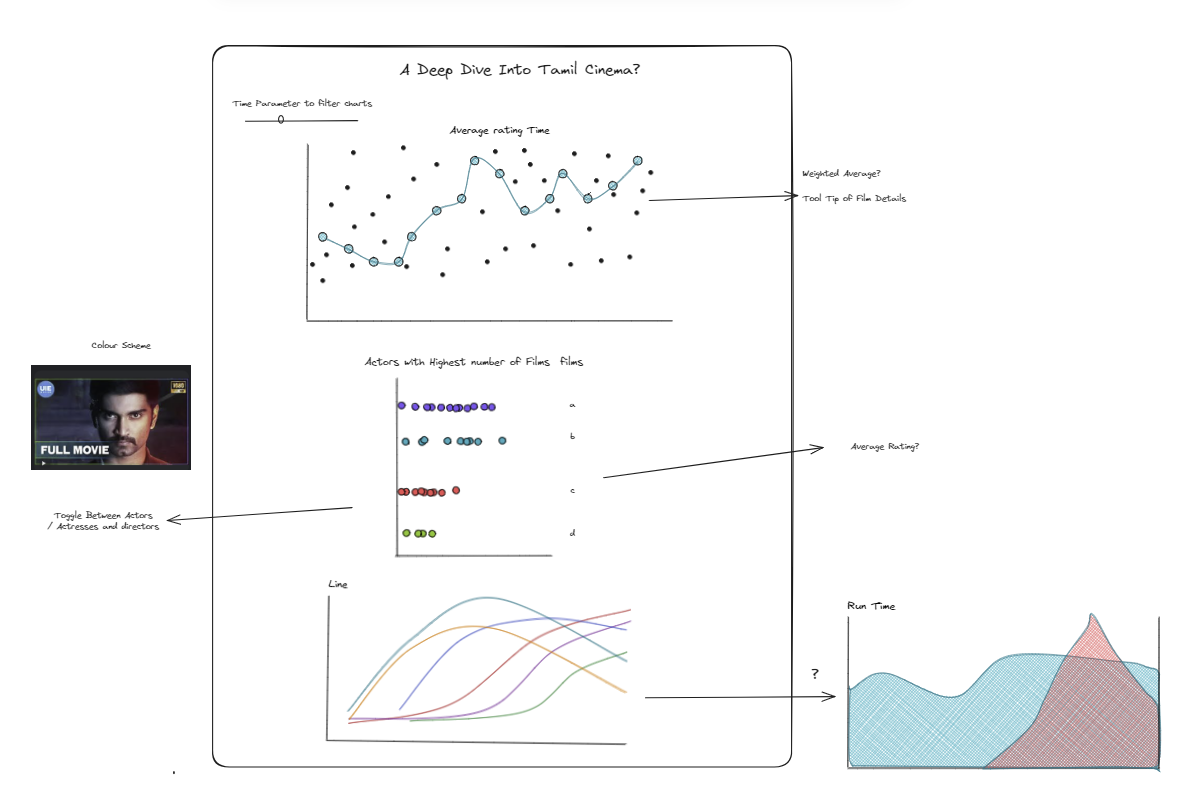
This was where I ended my day. My plan for the next day is to:
1) Rework how I visualise runtime chart
2) Put all charts together onto a dashboard
3) Format, Format, Format!