


Having gotten confident with how to prep data in Tableau Prep and Power Query I decided to try a PreppinData challenge (2021 week 1) I had completed in both TP and PQ, and try it in Python. As a result I wanted to try and document so differences I have found between the three.
The main steps for PrepingData challenge 2021 week 1 (https://preppindata.blogspot.com/2021/01/2021-week-1.html):
- Split the
Store-Bikefield int0 two separate fields. - Match misspelt entries in the bike columns to the correct spelling, e.g. Garvol to Gravel.
- Create a
QuarterandDay of Monthfield from the date field. - Remove the first 10 rows as they are test entry.
Tableau Prep:
Tableau Prep definitely has the most user-friendly interface; it’s modern, visual, and its drag-and-drop features are largely self-explanatory. Its biggest strength is giving you instant visual feedback at every step of your flow, though it can start to feel sluggish when you throw massive datasets or overly complex logic at it.

- In Prep it is possible to do this challenge in one clean step, however, I split out each step into separate clean steps making it easier to segment my workflow (this is very helpful for busier workflows).
- Adding descriptions make documentation easy.
Power Query:
Integrated directly into Excel and Power BI, Power Query turns everyday spreadsheets into automated ETL workflows, backed by a library of connectors and the flexibility of the M language. That said, its interface feels dated, and managing long, multi-step queries can feel clunky compared to modern visual tools.
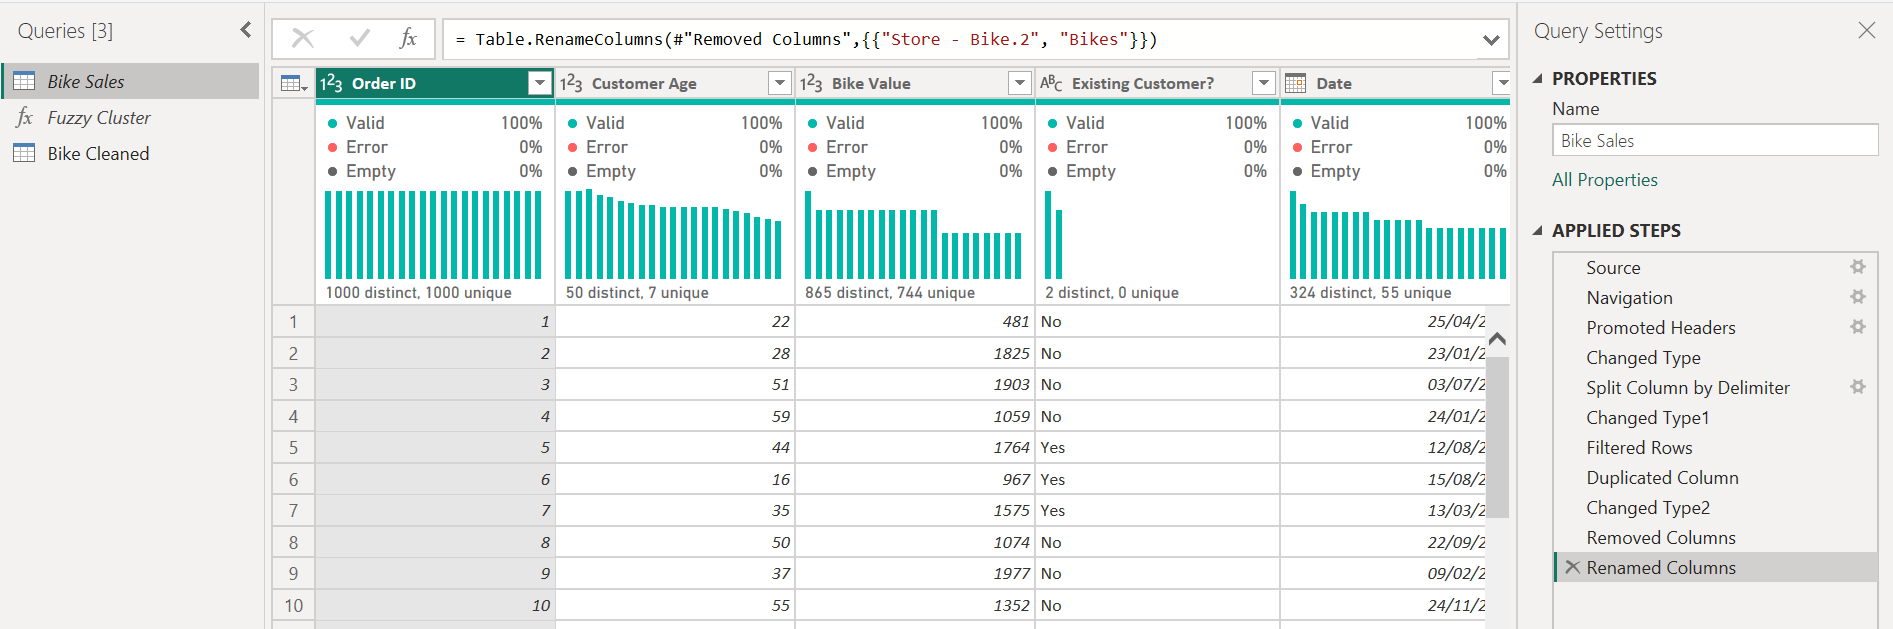
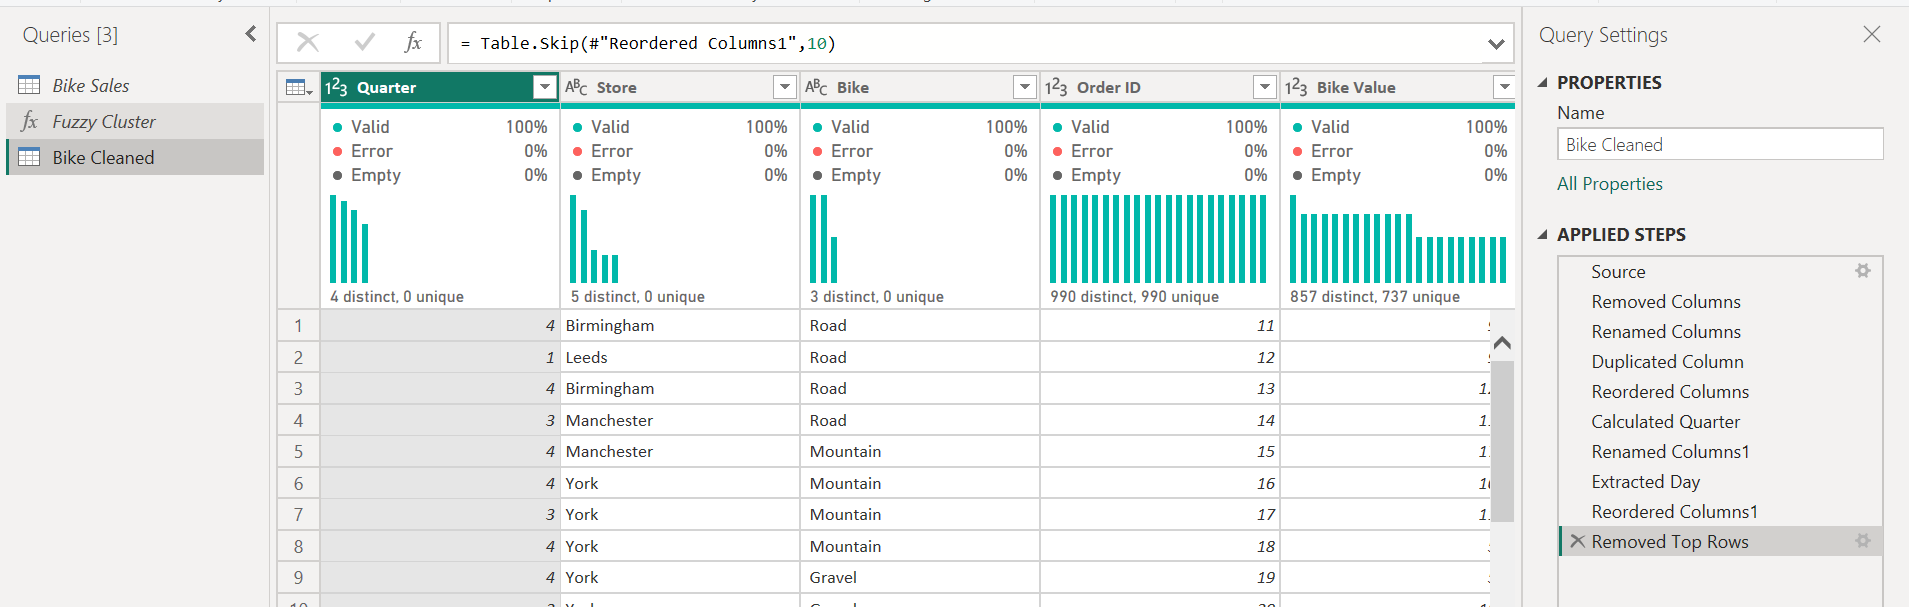
- Every step done in PQ is documented in the 'Applied Steps' pane on the right, these are renameable to help documentation.
- Table queries are pretty hard to use if you dont know how they work, the Fuzzy Cluster query confused me a lot to begin with but these are very powerful
Python:
Python offers unmatched flexibility and raw processing power, allowing you to automate virtually any data transformation imaginable with libraries like pandas. The trade-off is a much steeper learning curve, there’s no visual safety net here, so you’ll need to be comfortable writing and debugging code from scratch.
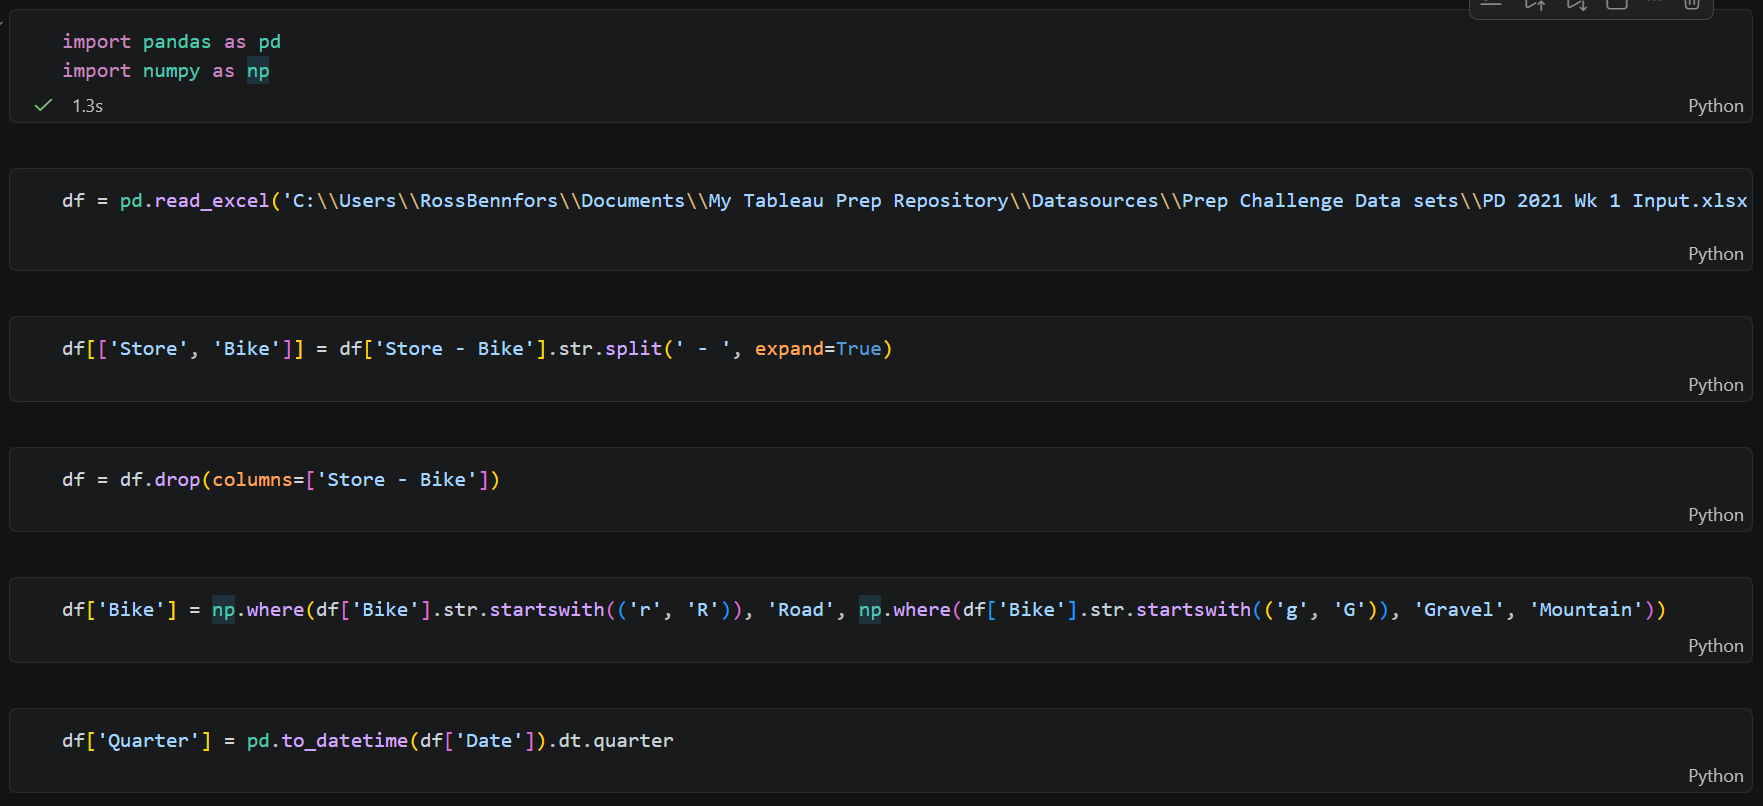
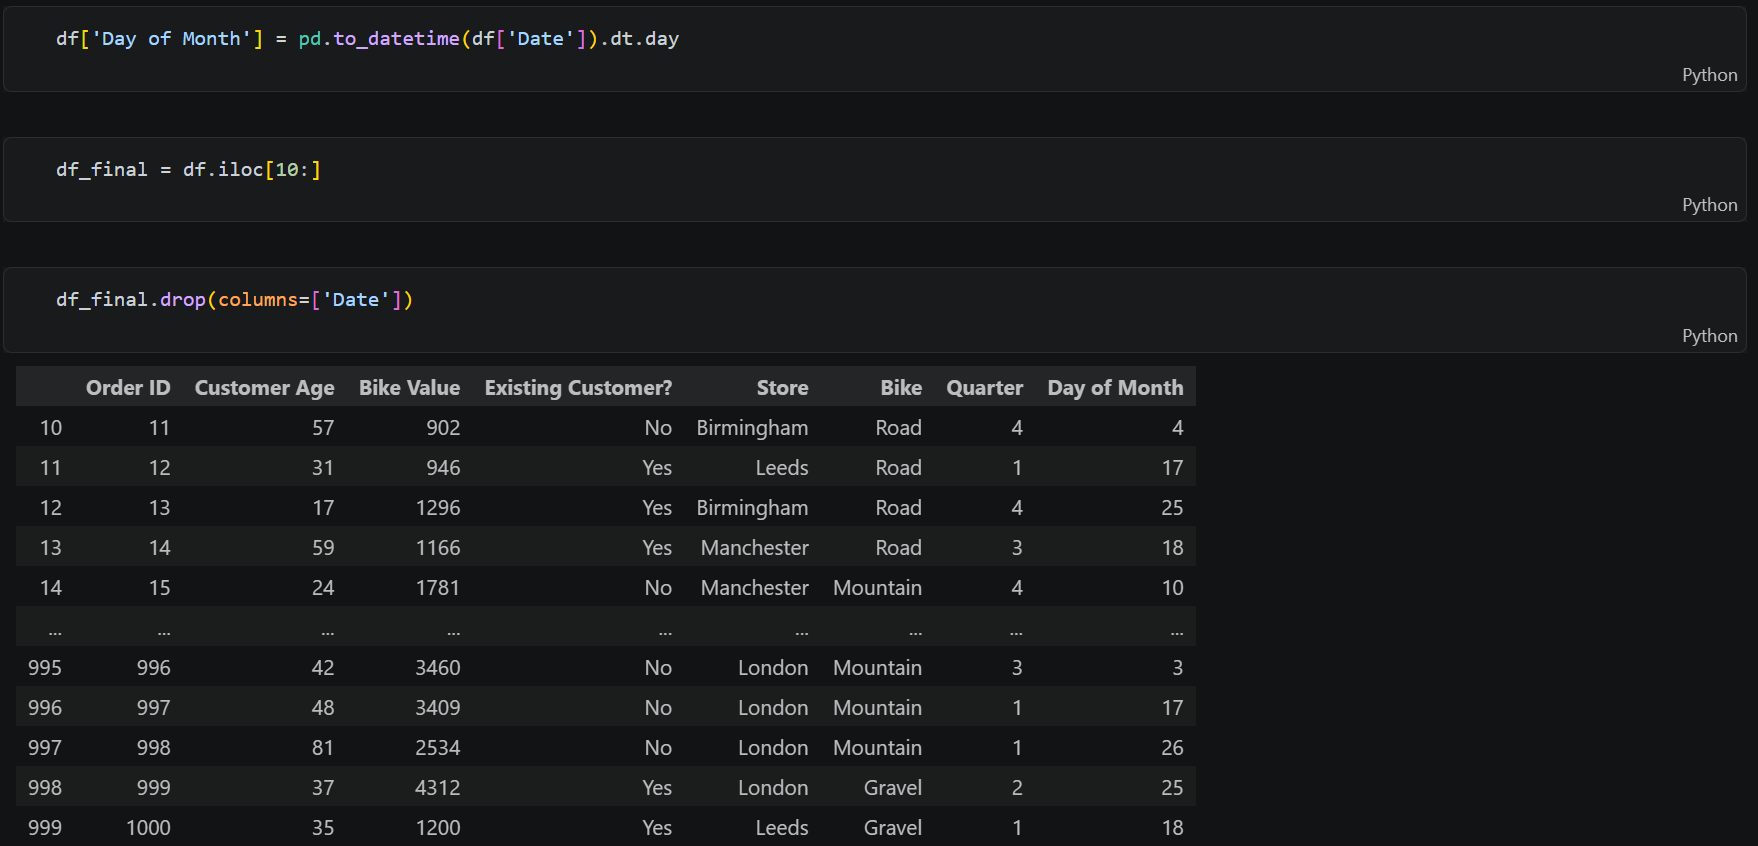
- In Python you have access to an enormous breadth of Libraries, Pandas and NumPy (I didn't actually end up using NumPy).
- Despite having experience in Python it took a fair bit of searching functions to know how to use Pandas DataFrames