


Preparing data using different programs
5 weeks have flown by at the data school and DS55 have learnt so many new skills and techniques, one of which has been data preparation. We can prepare data in many different programs and the ones I will be using are the ones which are taught at the TIL, namely are Tableau Prep, Alteryx, and Power Query.
I will be completing the same Preppin’ Data challenge (2023 Week 2) in each of them, showing the steps I take in each comparatively.
The data input was 2 different CSV files – Transactions.csv and Swiftcodes.csv
The steps are below for the challenge with screenshots of the progress for each step.
1. In the Transactions table, there is a Sort Code field which contains dashes. We need to remove these so just have a 6 digit string
Power Query:
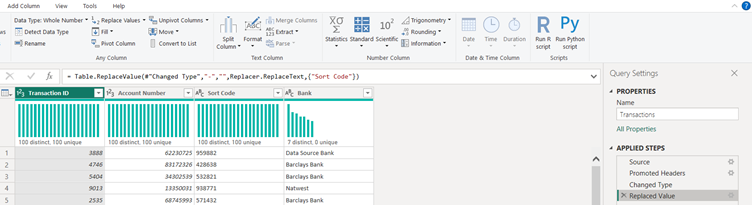
In Power Query it is quite simple to remove values, I chose to use the ‘replace values’ function and selected the column and values I needed to replace. You can see in the DAX code what Power Query is actually doing
Tableau Prep:
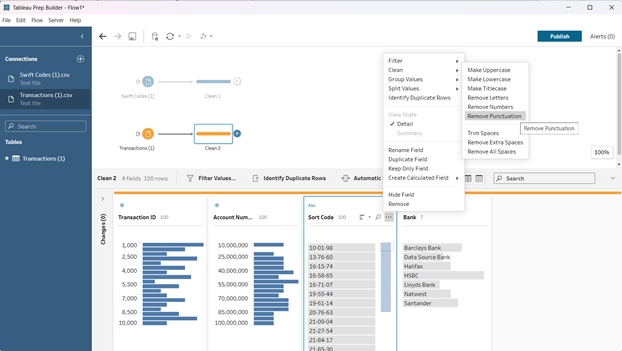
In tableau prep to remove the hyphens I used the ’Remove Punctuation’ function by clicking on the 3 dots on the field I needed changing.
Alteryx:
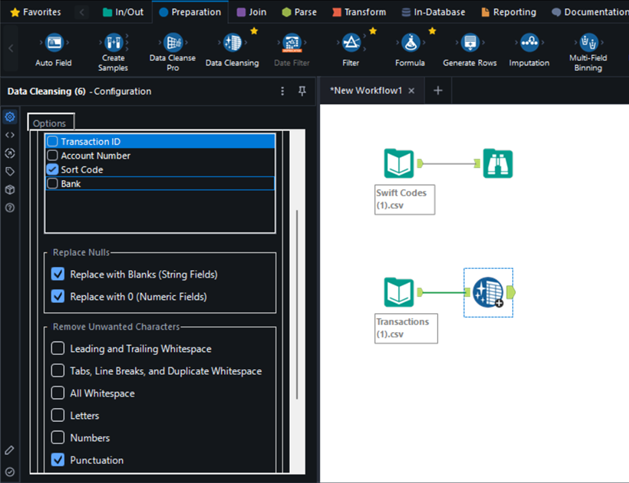
In Alteryx, I added a simple ‘Data Cleansing’ tool and went ahead on the configuration tab to select only the ‘Sort Code’ column and then removed all the punctuation.
2. Use the SWIFT Bank Code lookup table to bring in additional information about the SWIFT code and Check Digits of the receiving bank account
Power Query:
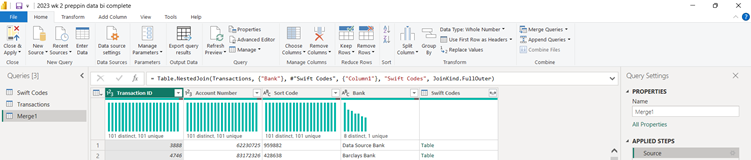
I then ‘merged’ (joined for all us normal folks) the tables together using the ‘Merge Queries’ function on the field of ‘Bank’ as this was a common key in both of the original tables.
Tableau Prep:
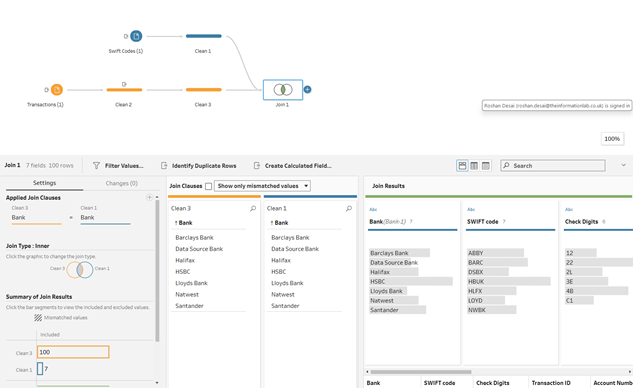
In Tableau Prep, to join 2 data sources with each other you need to drag one over the other onto the ‘Join’ icon that will show up. From there, drop the clean step and choose the matching join clauses on the bottom left of the screen. Again, you need to make sure that the field is the same in both of the data sources.
Alteryx:
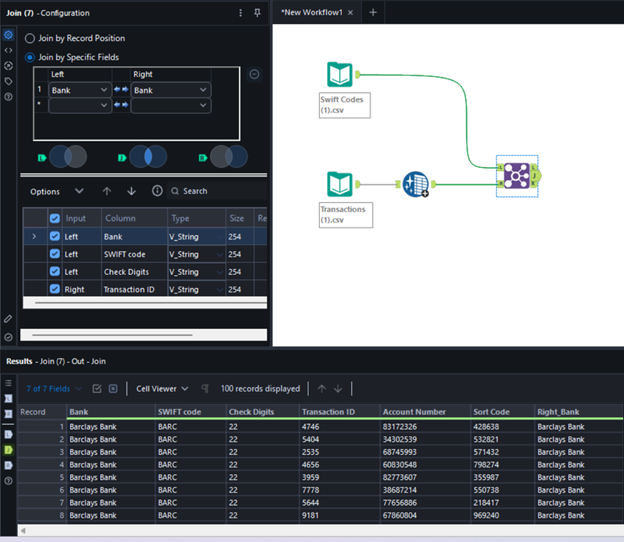
I then used the ‘Join’ tool to join the two data sources together on their matching field, which is seen on the left in the configuration tab.
3. Add a field for the Country Code
Power Query:
I needed a custom country code as GB for all transactions. This was not anywhere in the data so I created a new custom column with the value of 1 for every row. I then simply used the ‘Replace Values’ function as I had done previously and changed the value from ‘1’ to “GB”.
Tableau Prep:
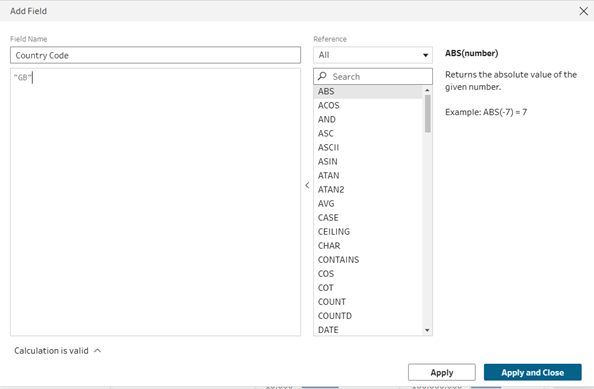
I created a custom field in prep and used the string “GB” to create this field. Due to the fact it is the same throughout the data, creating this field will populate GB in a new column for each record.
Alteryx:
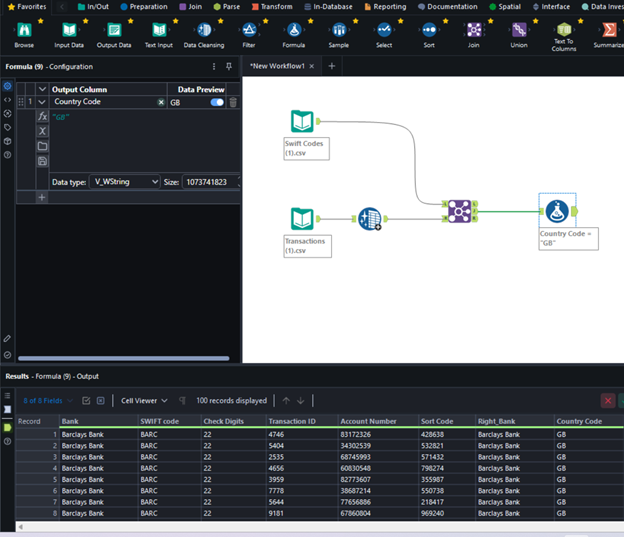
To create a calculated field in Alteryx, you need to use the ‘Formula’ tool. I dragged this into my workflow and then created a new column with GB as the field value. This is also represented in the data at the bottom of the image.
4. Create the IBAN as above
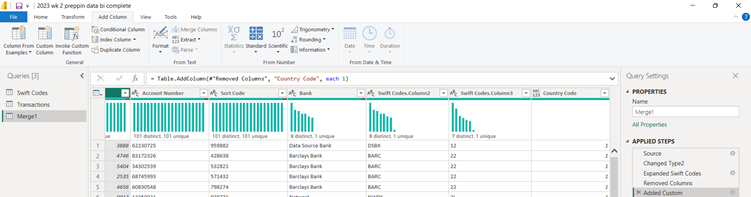
Power Query:
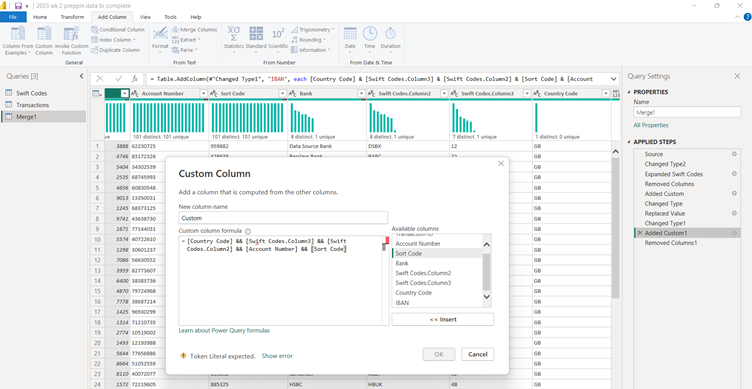
To do this next I had to merge a few of the existing columns together. I used the ‘Custom Column’ function to do this and created a simple calculation to create my new, IBAN field.
Tableau Prep:
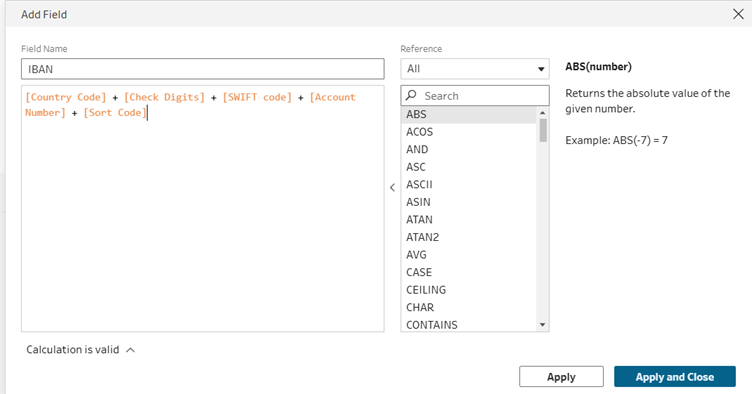
I created another calculated field, adding all the necessary fields I needed for my IBAN. I needed to be careful with this step and ensure all the data types were the same before merging the columns into one.
Alteryx:
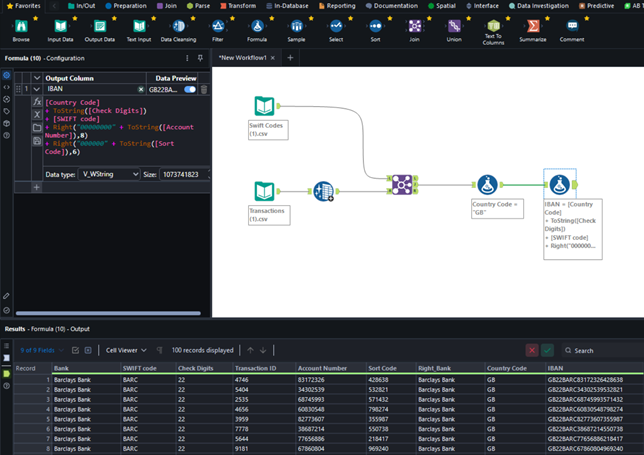
In Alteryx, I then added another formula tool. You can actually add as many formulas as you would like in the one formula tool, but for best practice and documentation I decided to have a new step. My calculated field makes sure to turn all the fields into strings.
5. Remove unnecessary fields
Power Query:
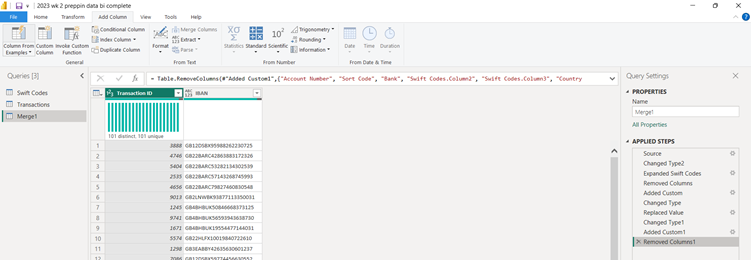
Finally I removed the columns I didn’t need by selecting them and deleting them, with my output then matching the intended result!
Tableau Prep:
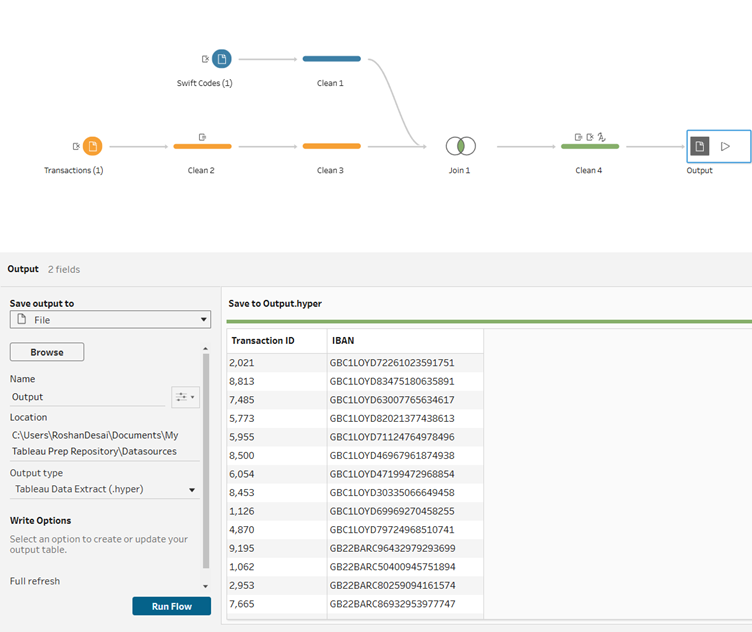
I finally removed the final fields which I didn’t need and added an output stage to the end of my flow so that I can output this to a specific data file, ready for analysis if necessary.
Alteryx:
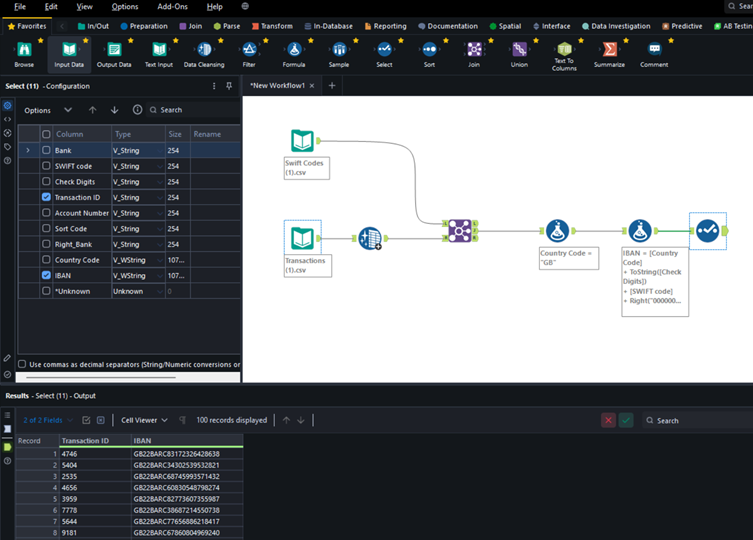
I added a simple ‘Select’ tool to remove the unwanted fields and only tick the fields I wanted. The output is at the bottom and is the intended output!
My favourite program to use for this was Alteryx, although only having half a day use on this program I find it very intuitive and easy to understand. Alteryx is very user friendly due to it’s drag and drop function as well as having most steps as a different ‘tool’.