


When you’re building a Tableau dashboard, you’ll often need to perform deeper calculations to manipulate your data and gain better insights. But with options available like Calculated Fields, Table Calculations, and Level of Detail (LOD) Expressions—it can be tricky to know which one to choose.
Each of these calculation types has its own strengths and use cases, so understanding when to use each one is important. Whether you’re combining data, performing aggregations, or diving deeper into specific dimensions, this guide will help you figure out which calculation works best for your specific need.
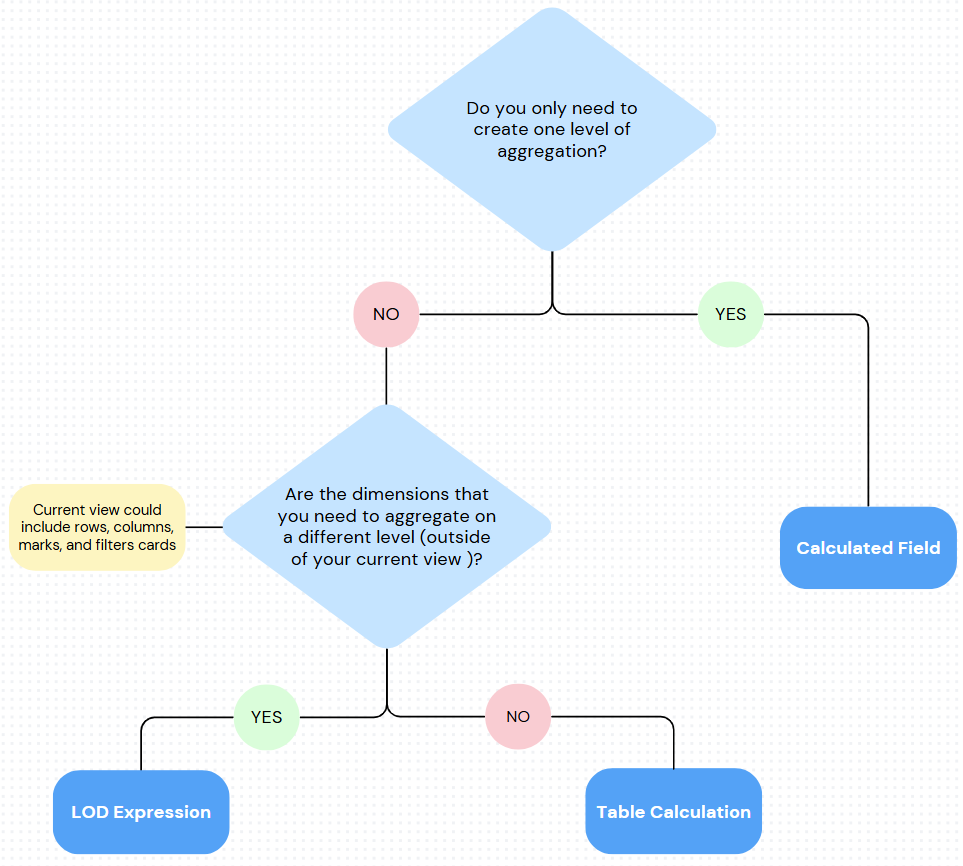
The Quick Answer
Use the decision tree below to determine which calculation is best for your situation:
1. Start with Calculated Fields
When you need to create a new value from the data you already have in your dataset, Calculated Fields are your first port of call. This is especially useful when you have the relevant fields, but they're not in the format you need.
Use Calculated Fields when:
- You have the necessary fields, but they're not in the right format.
- You need to create a new measure or dimension (e.g., Profit Ratio).
- The data already exists in your dataset, and you just need to combine or adjust it.
Example: If you have Profit and Sales but need a Profit Ratio, you would create a calculated field:
Profit Ratio = Profit / Sales. This lets you calculate a new field based on existing ones without altering your data structure.
2. When to Use Table Calculations
If your dataset is already in the right format but you need additional aggregation, Table Calculations are the next step. These calculations operate directly on the data in your view (e.g., in rows, columns, or marks) and are great for things like running totals, rankings, and moving averages.
Use Table Calculations when:
- You need a secondary level of aggregation on top of the data in your view.
- The calculation depends on the data that's currently displayed in your chart (e.g., by rows, columns, or filters).
Example: If you want to calculate a running total of sales or rank products by Profit, table calculations are perfect. You can perform these calculations on the data displayed in the view without altering the underlying dataset.
3. When to Use Level of Detail (LOD) Expressions:
LOD Expressions come into play when you need to calculate something at a specific level of granularity, beyond what's currently shown in your view. They allow you to perform aggregations at different levels, even if those levels are not part of the visible view.
Use LODs when:
- You need to aggregate data at a level not represented in your view (e.g., calculating total sales at the region level while your view is by product category).
- You need to reference dimensions that aren't part of your current view.
- You need to perform calculations that remain fixed, regardless of other filters or dimensions in the view.
Example: A FIXED LOD expression like SUM([Sales]) calculated at the Region level ensures that the calculation works at the region level, no matter what’s shown in the view (e.g., product category).
Putting It All Together: When to Choose What?
- Start with Calculated Fields if you need to create a new measure or dimension from existing data, like calculating a profit ratio or sales growth.
- Move to Table Calculations if your view already has the right data, and you need additional aggregations based on what's visible in the chart (like a running total or rankings).
- Use LODs if your calculation needs data that isn't part of your view, or you need an aggregation fixed at a particular level (e.g., regional total sales).