


Welcome to the Tableau Next Blog Series!
In this 5-part series, I’ll walk you through the end-to-end process of working in Tableau Next — from loading data all the way to building a functional dashboard.
Looking for a summary of what Tableau Next actually is? Follow this blog: [link coming soon]
This blog is about building a Dashboard from your visualisations. It’s based on the latest version available in July 2025.
What We'll Cover
- Dashboard Builder UI
- Inputting Text
- Inputting Visualisations
- Inputting Metrics
- Inputting Filters (List and Toggle)
- Filter Interactions
- Dashboard Size and Containers
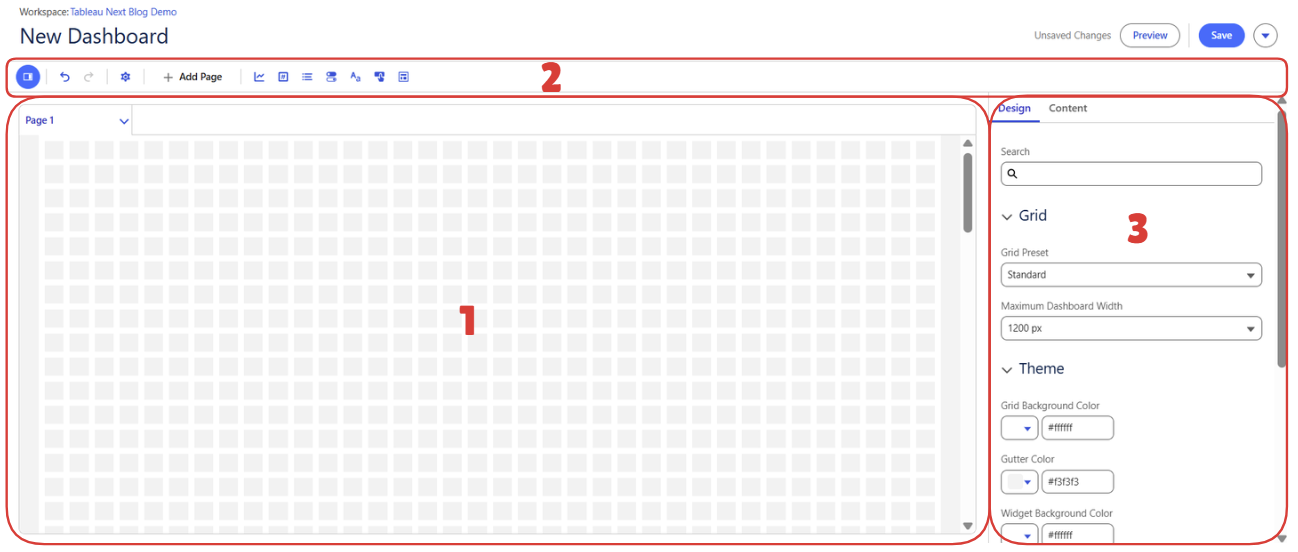
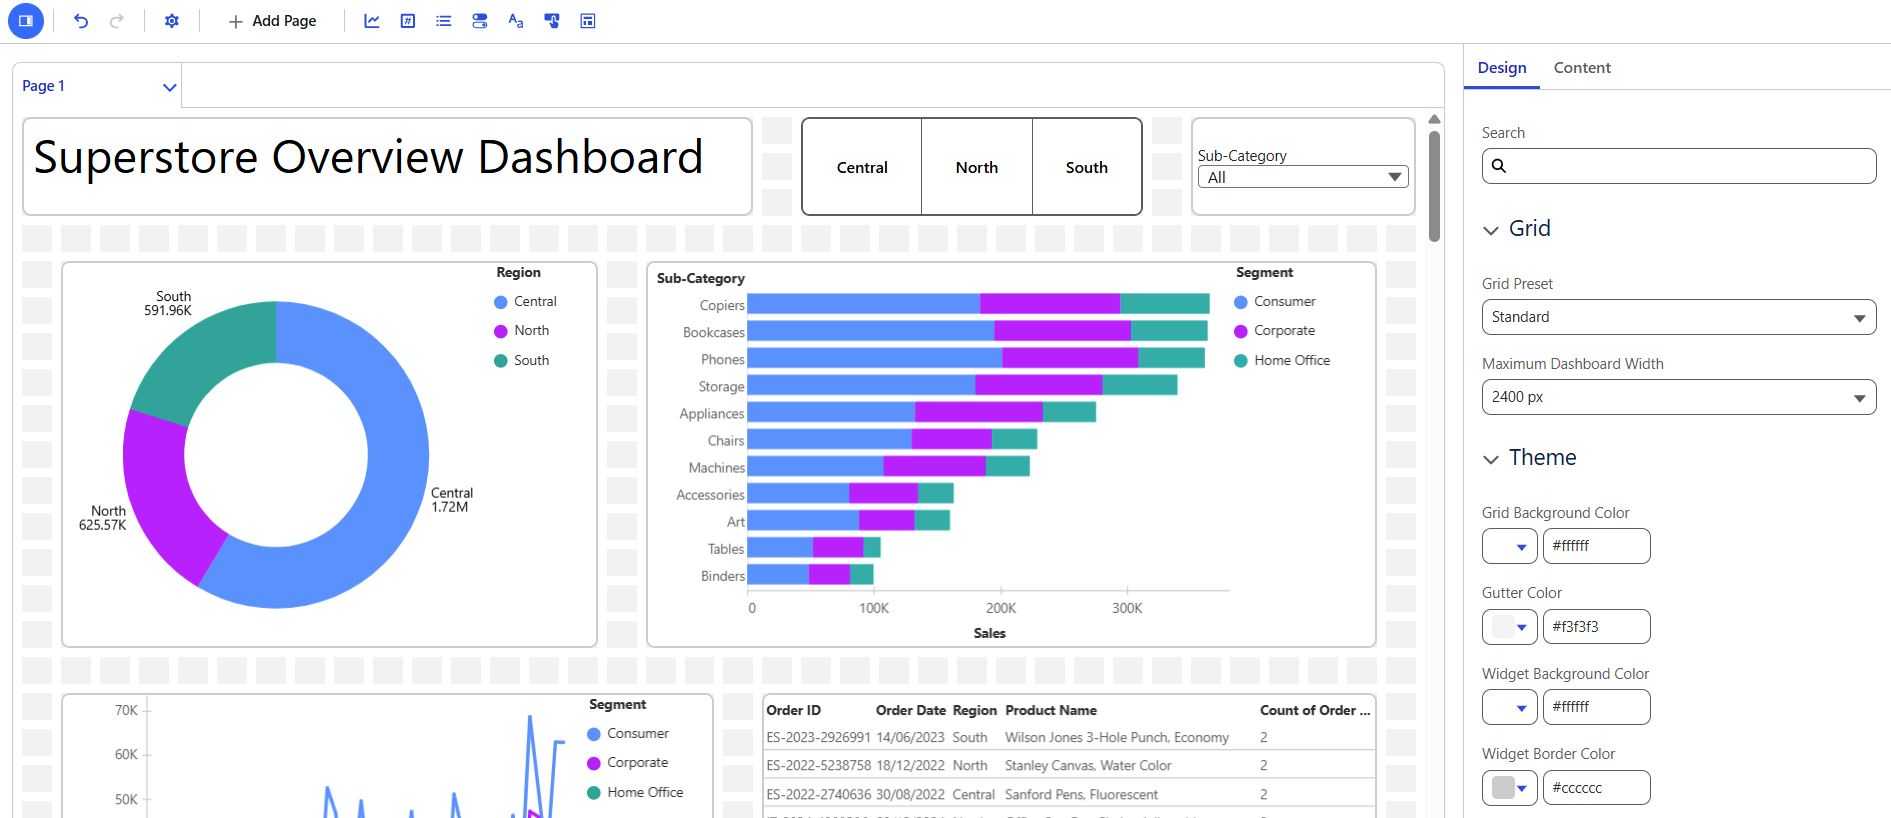
Dashboard Builder UI
The Dashboard Builder interface can be broken into three key parts:
- Page View: This is your main canvas — where all visualisations and elements are placed.
- Toolbar: Lets you bring in different elements such as visuals, metrics, filters, containers, lists, and text. You can also configure dashboard properties and add multiple dashboards (called “Pages”).
- Side Panel: Used for formatting design and content, and setting up interactions between dashboard elements.
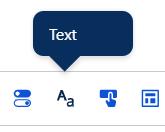
Inputting Text
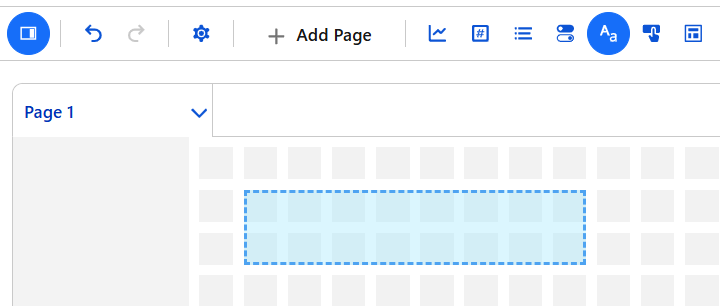
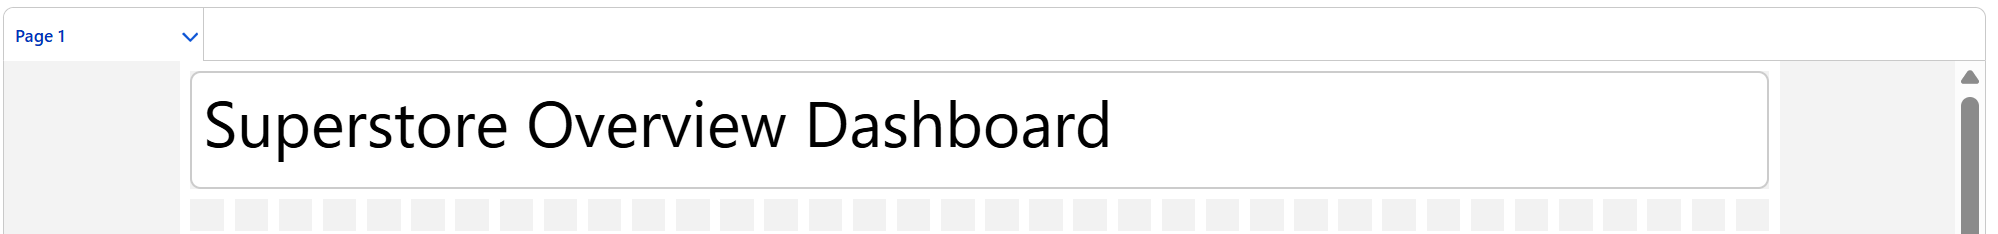
You can add text using the Text button on the toolbar. When starting a dashboard, it’s a good idea to first add a title using this option.
Unlike classic Tableau dashboards, the Tableau Next canvas is grid-locked and square by default, giving it a more structured layout.
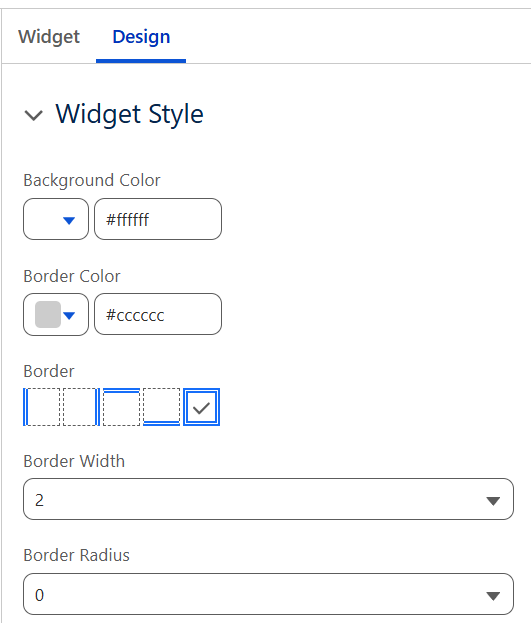
Once your text is added, use the Widget Pane (right-hand side) to:
- Format text (font, size, alignment, etc.)
- Resize the text box

- Adjust design elements such as background color, border color, which sides the border appears on, width, and radius.
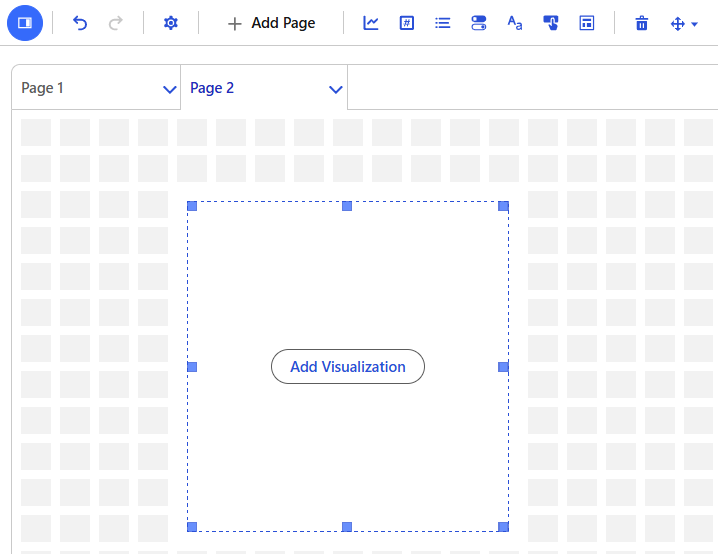
Inputting Visualisations
To bring in a visualisation, click the Visualisation button on the toolbar.
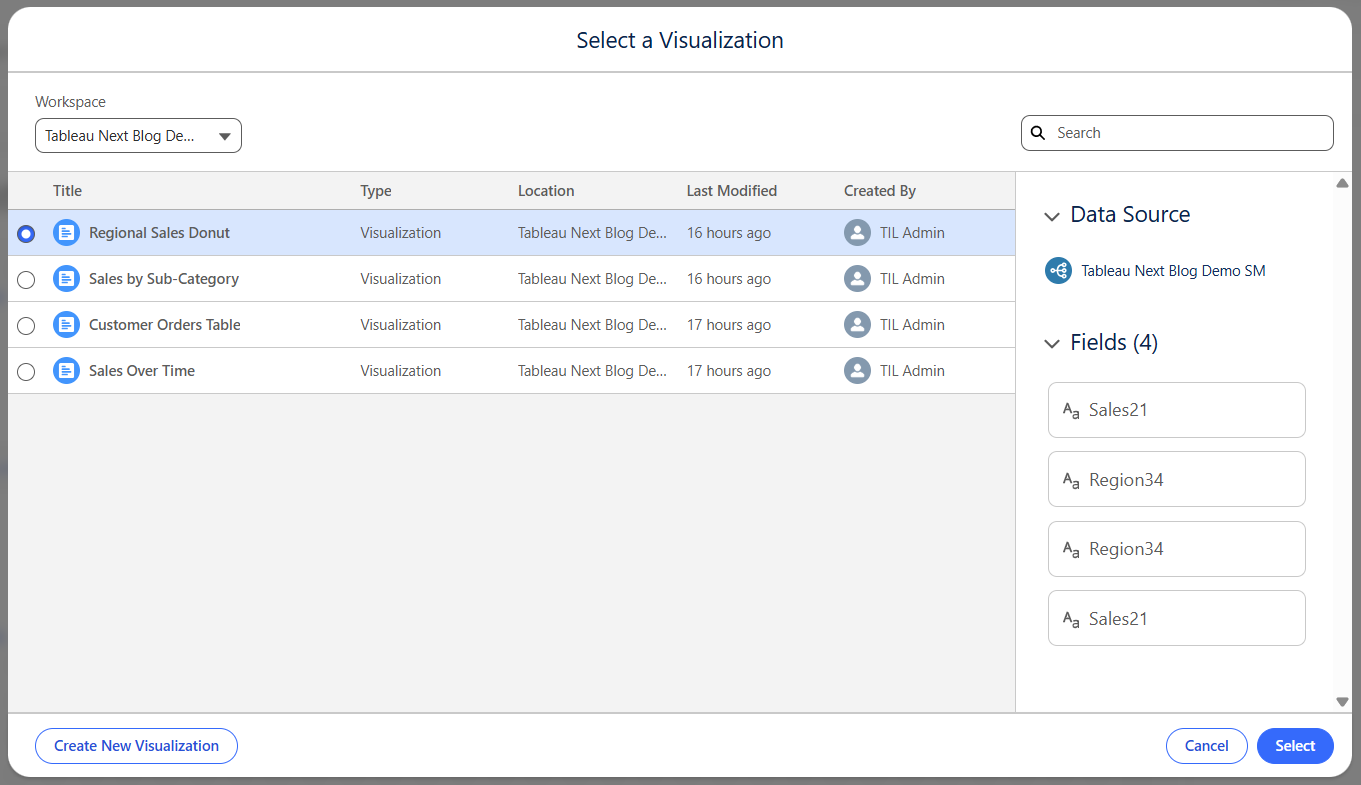
Let’s start by adding the Pie Chart we built in the previous blog post. When you place a visual container on the canvas, you’ll be prompted to select a visualisation.
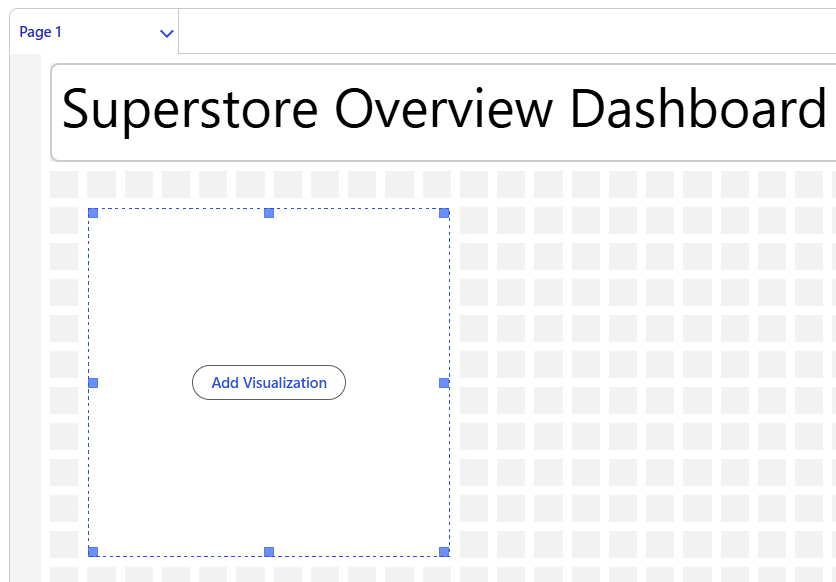
Tableau Next will automatically detect all visuals built in your Workspace. It references both the data sources and the fields used in those visuals.
Note: Since you’re dragging in a single visual container, you can only select one visualisation at a time.
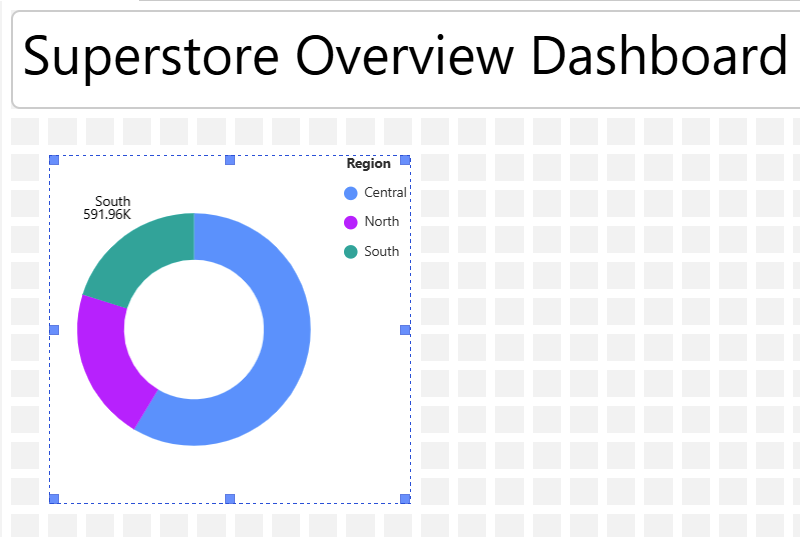
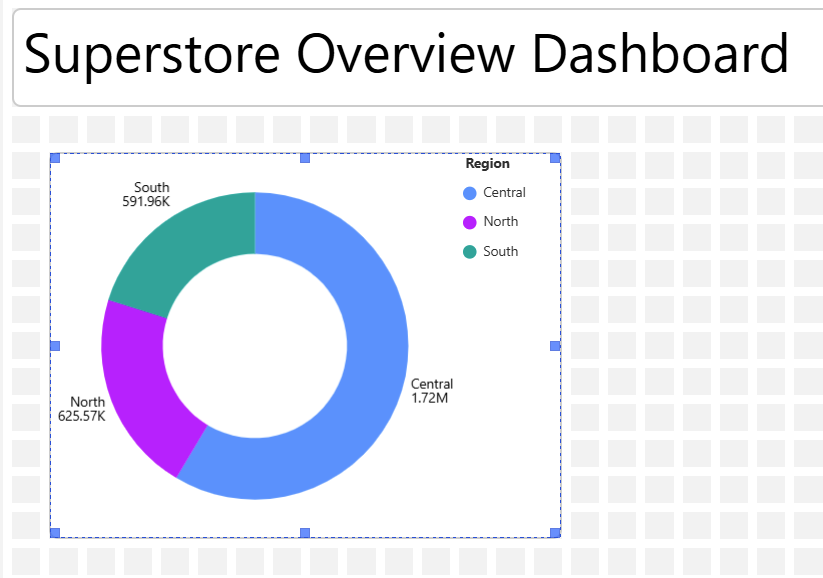
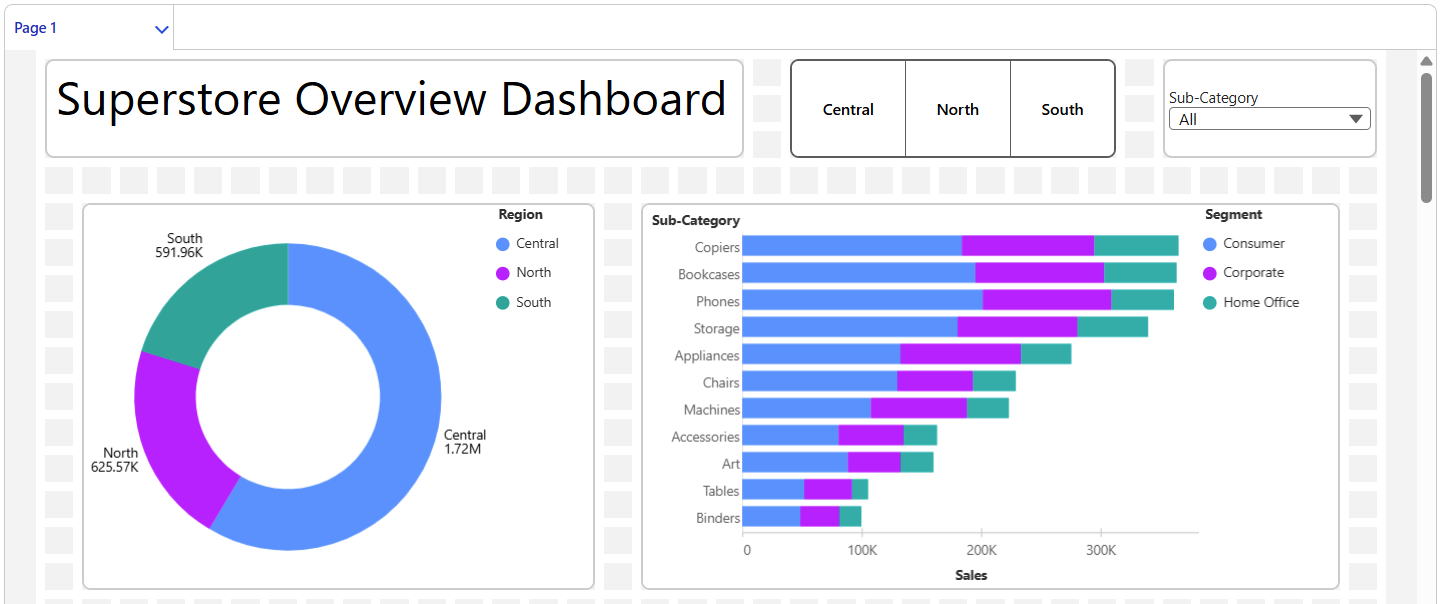
Once added, the visual defaults to the container size — and labels may get cut off. For example, only one label may show on the pie chart ("South 591.96k"). Simply resize the visual to make all labels visible. Just like with text, you can also style the visual by adding borders, adjusting background color, and so on using the Widget Pane.
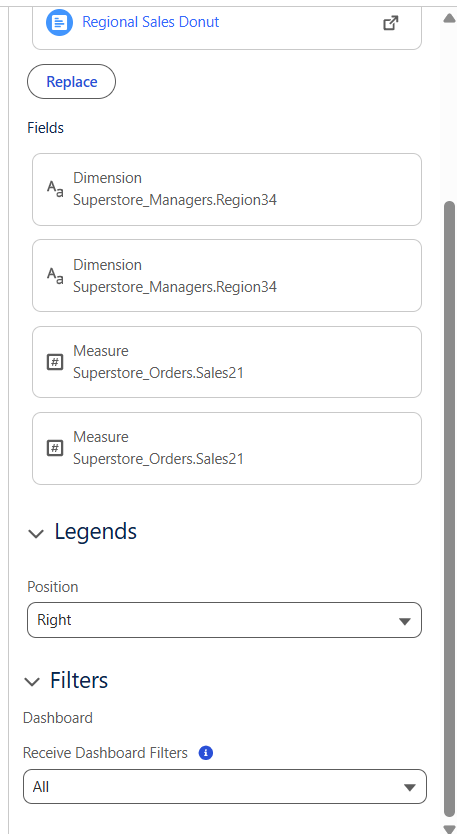
Further down in the widget pane, you’ll find Legend options — including where to position them.
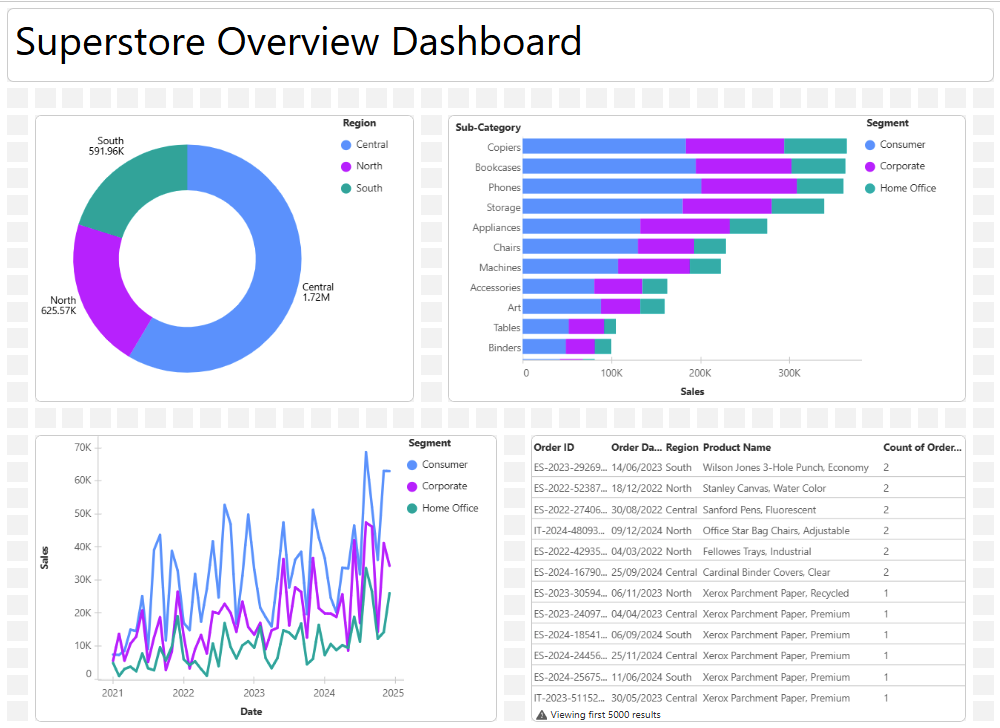
Let’s now add the other three visuals we created previously. Resize them as needed for a clean, simple demo layout.
Inputting Metrics
Metrics in Tableau Next look similar to visualisations, but they are created during the Semantic Model stage, not the Visualisation stage.
To add a metric, click the Metric button in the toolbar.
Tableau Next will prompt you to select the Workspace and Metric to bring in.
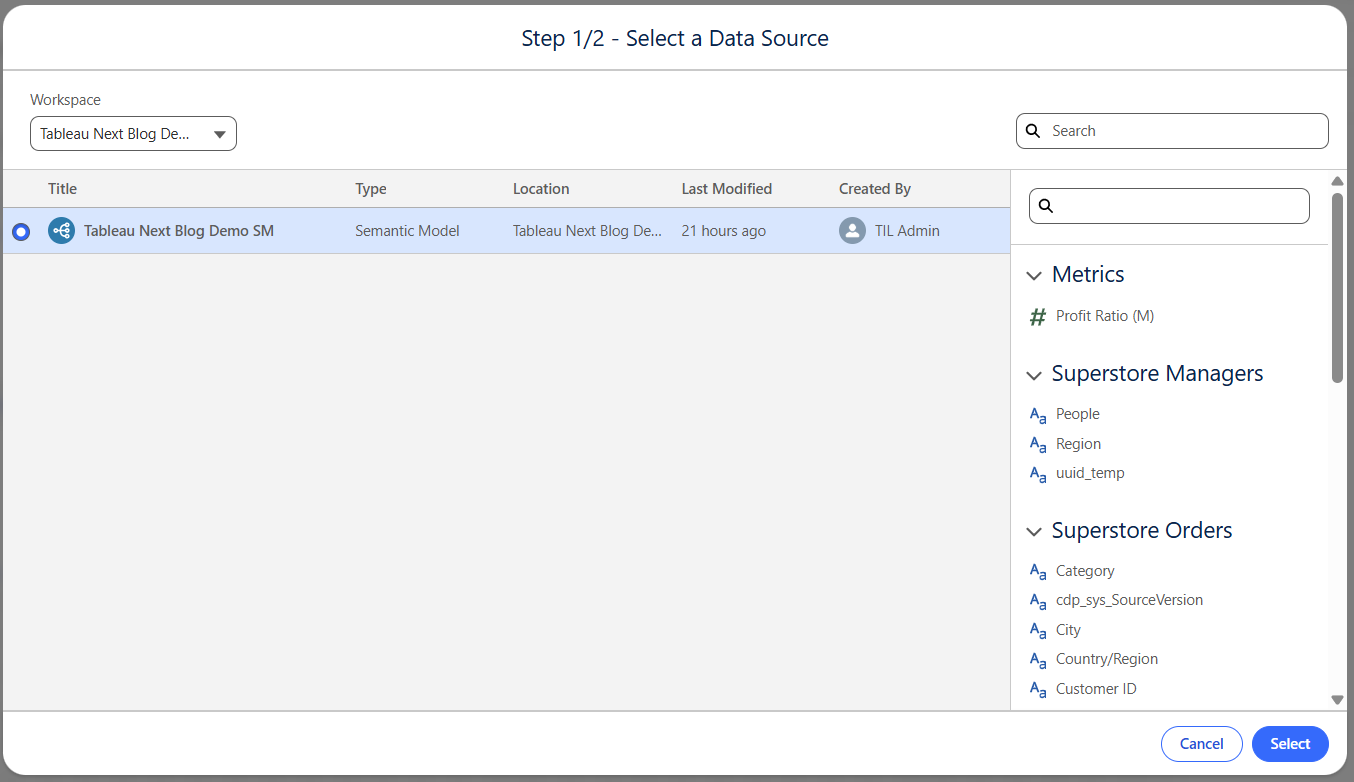
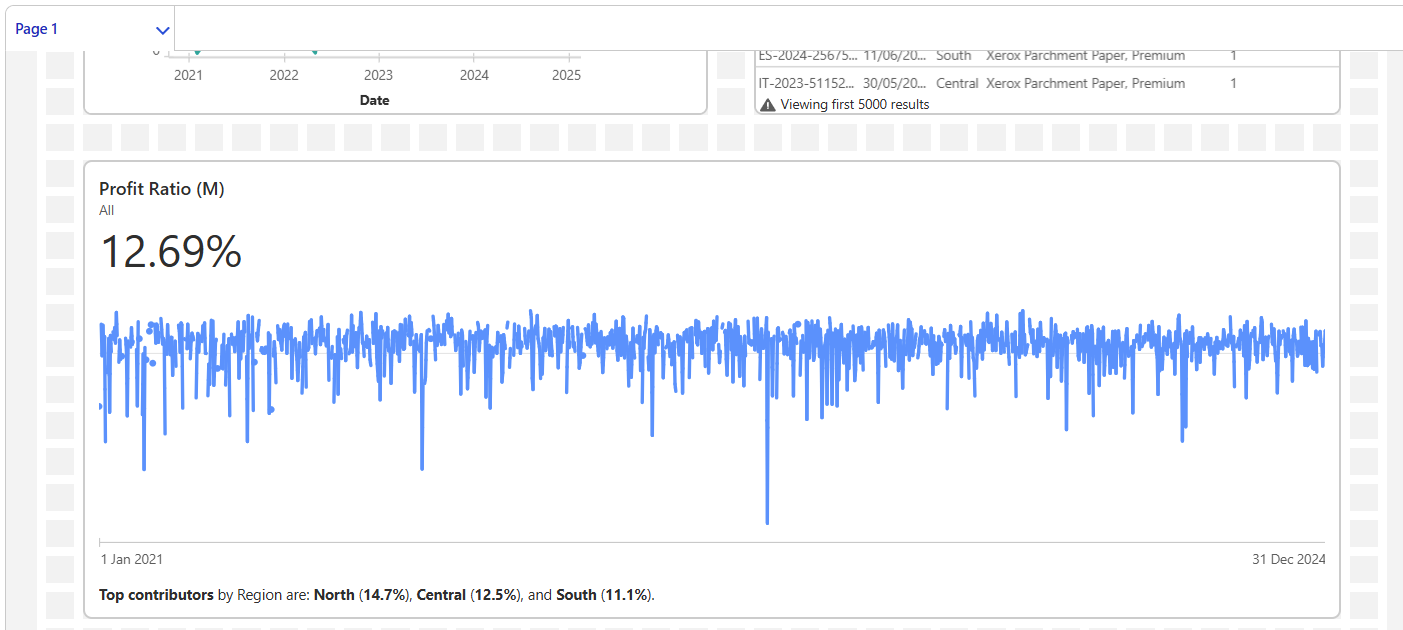
Once selected, the metric appears with suggested insights based on the fields you included when building the metric.
We’ll talk more about how filters interact with metrics later. This is important — the wrong filter setup can break your metric.
Inputting Filters
You can add filters using the List and Toggle options from the toolbar.

Let’s bring in:
- Region as a Toggle
- Sub-Category as a List
I’ve resized some charts to make room for filters on the canvas.
Preview Mode
You might notice that clicking filters doesn’t actually change the charts right away. To test filter interactions, switch to Preview Mode.
For example:
- Select South for Region
- Select Phone for Sub-Category
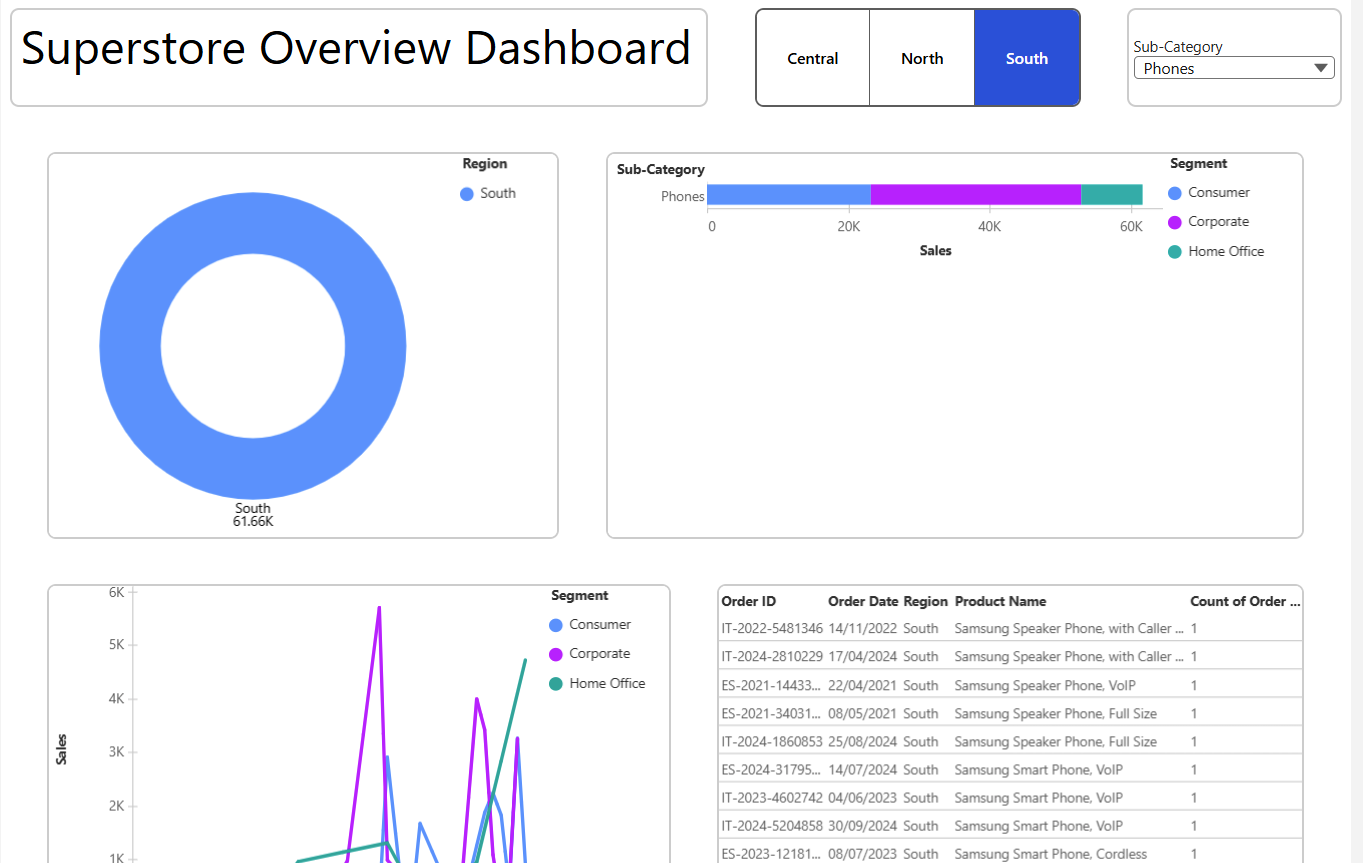
You’ll see the charts update — including the metric.
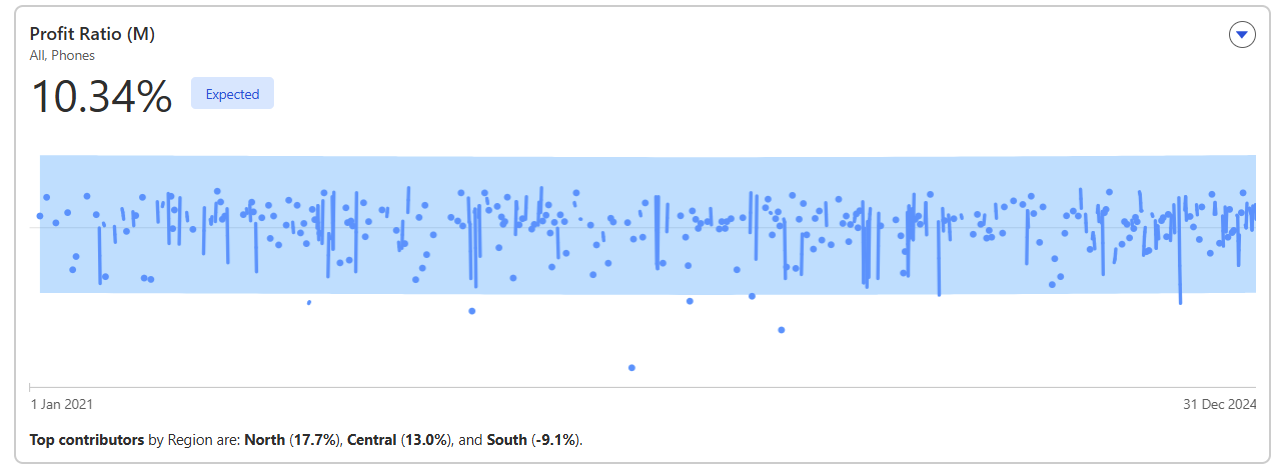
Why? Because when we created the metric, we included Region and Sub-Category in the "Additional Dimensions" section. If we hadn’t, the metric would break and show an error.
Keep this in mind when creating metrics — they must be configured to accept filters.
Filter Interactions
Filters aren't limited to lists and toggles. Charts can also act as filters when a user clicks a point or bar.
To enable this:
- Click on a visualisation.
- Scroll down to the Filters section in the Widget Pane.
- Configure how that chart behaves as a filter for other charts.
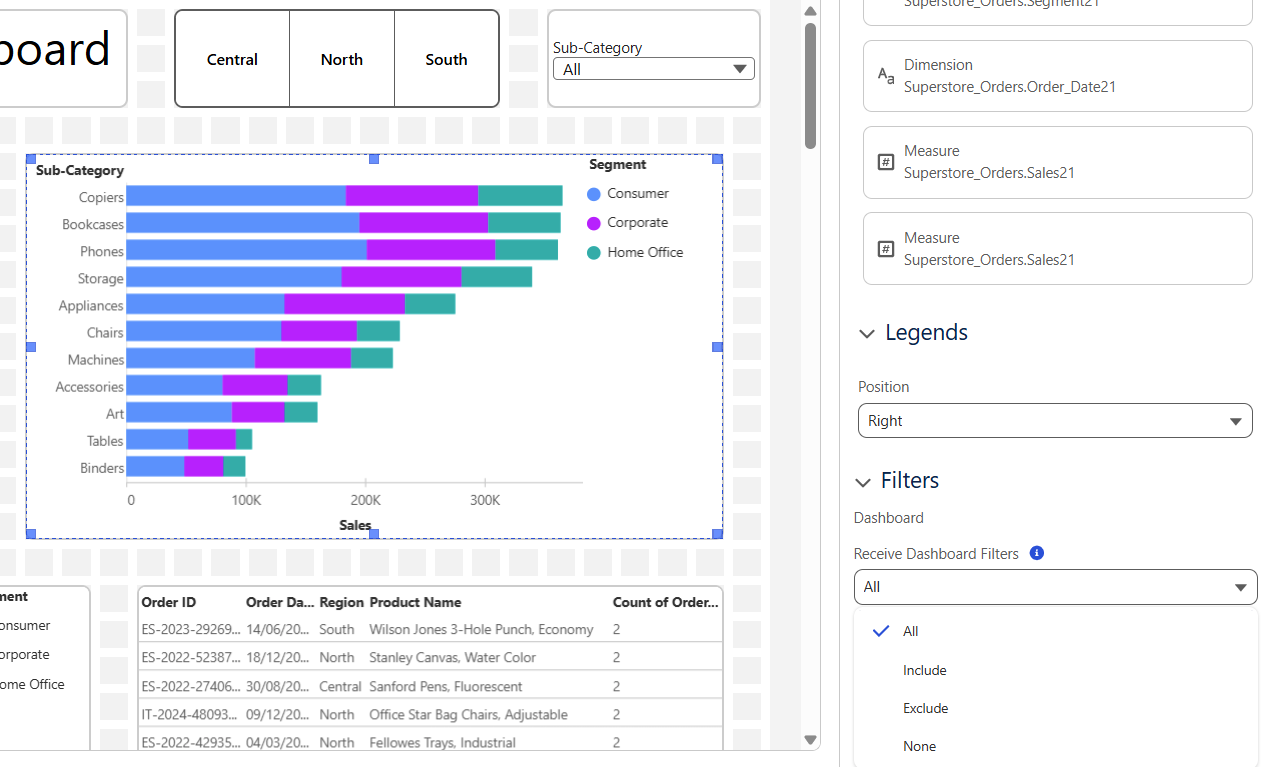
You’ll see options for how the chart receives dashboard filters:
- All: Accepts all filters
- Include: Includes only selected values
- Exclude: Excludes selected values
- None: Ignores dashboard filters entirely
Example:
If you set the stacked bar chart to "Exclude" and then click Central on the pie chart, the stacked bar will exclude values related to Central.
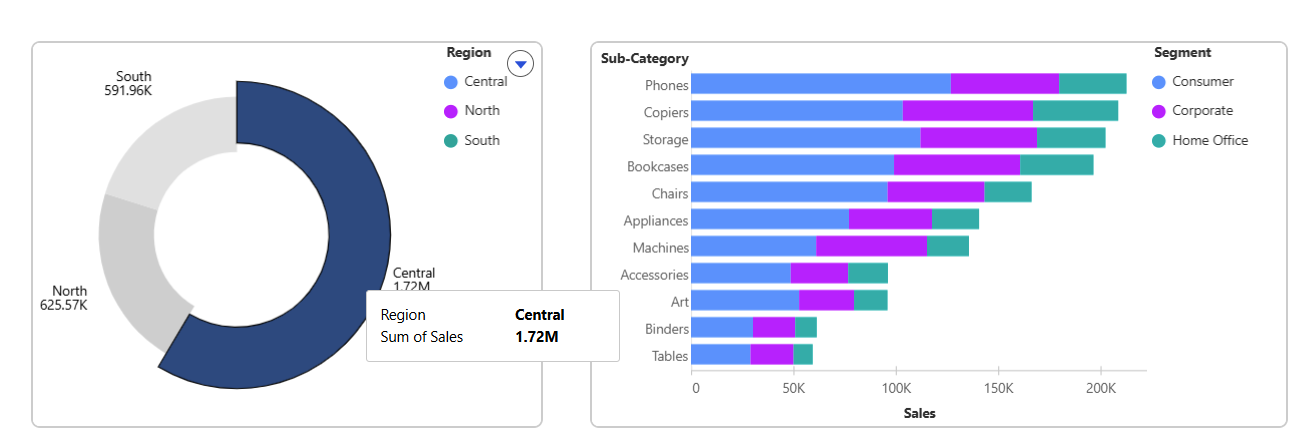
For Metrics, chart filters only apply if the metric includes those dimensions at creation. Otherwise, you’ll get an error.
Dashboard Size and Conatiners
You can adjust the dashboard size, grid spacing, and other layout settings using the Dashboard Properties button on the toolbar.
Why Use Containers?
If you want to resize your dashboard (e.g., make the page larger), containers help maintain layout stability.
Without containers, your visualisations may auto-resize to fill the new space — which might not be ideal (like below where the Dashbaord Width has been increased)
Containers are available in the toolbar. Once placed:
They appear as empty boxes (no “Add Visualisation” prompt).
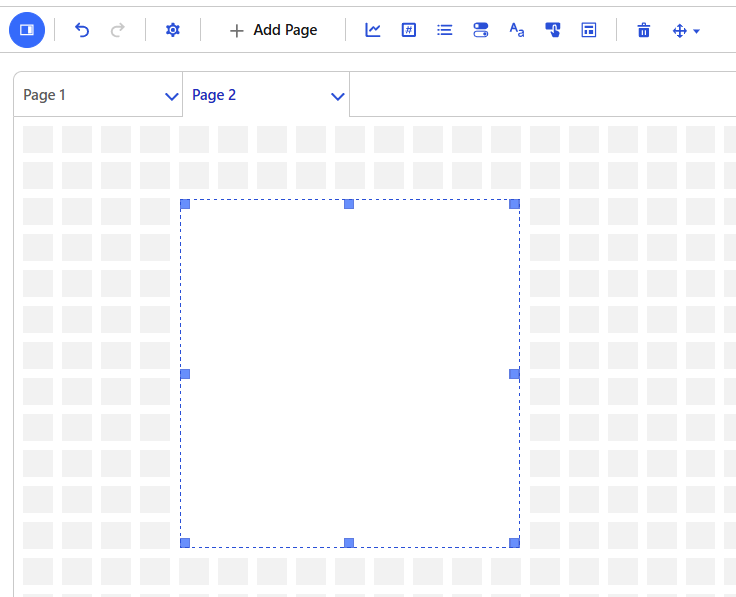
You can drag a visualisation on top of the container box. Then, choose which visualisation to display.
Using containers gives you more control when resizing dashboards, especially for responsive layouts or complex multi-element designs.
You Did It!
And that’s it — you’ve officially built your first Dashboard in Tableau Next. You now know how to brin in visuals, text, metrics, add filters and interactions, and understand containers
Next up in Part 5: We'll dive into Agent Force — a new and exciting part of Tableau Next designed to support smart interactions and insights.