


One of the biggest challenges in Power BI is providing users with enough filters without cramping the dashboard's design. The "Hidden Filter Menu" is the gold-standard solution for this, it gives you a clean look while maintaining full interactivity.
Based on a Superstore Analytics Dashboard I made, here is the step-by-step guide to building a professional, pop-out slicer panel using Bookmarks and the Selection Pane.
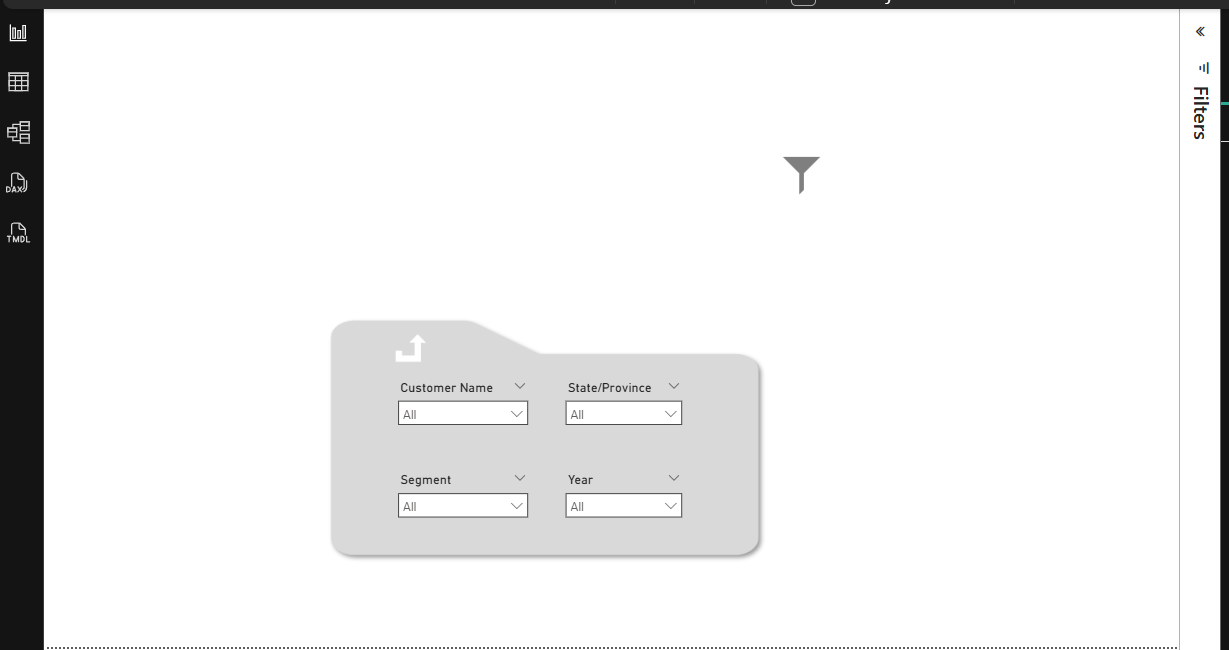
Step 1: Design the Slicer Panel
Before adding the "magic," you need to build the physical container for your filters.
- Start a New Page: Click the '+' at the bottom to add a new page in Power BI desktop so we don't accidently ruin any of our dashboard
- Add a Shape: You can either use a shape within Power BI or what I did is went to powerpoint, clicked insert icon and found an icon that looked like a folder. I then saved the image and went to insert image in Power BI to bring it into my report page.
- Format the Panel: If using a native shape, give it a solid fill color (e.g. dark grey) and set the transparency to about 5-10% to make it look like an overlay. You can do this within the format menu in Power BI. I formated my folder image in powerpoint. To do this right click on the icon, click format graphic and change the fill colour and transparency to your desired preference.
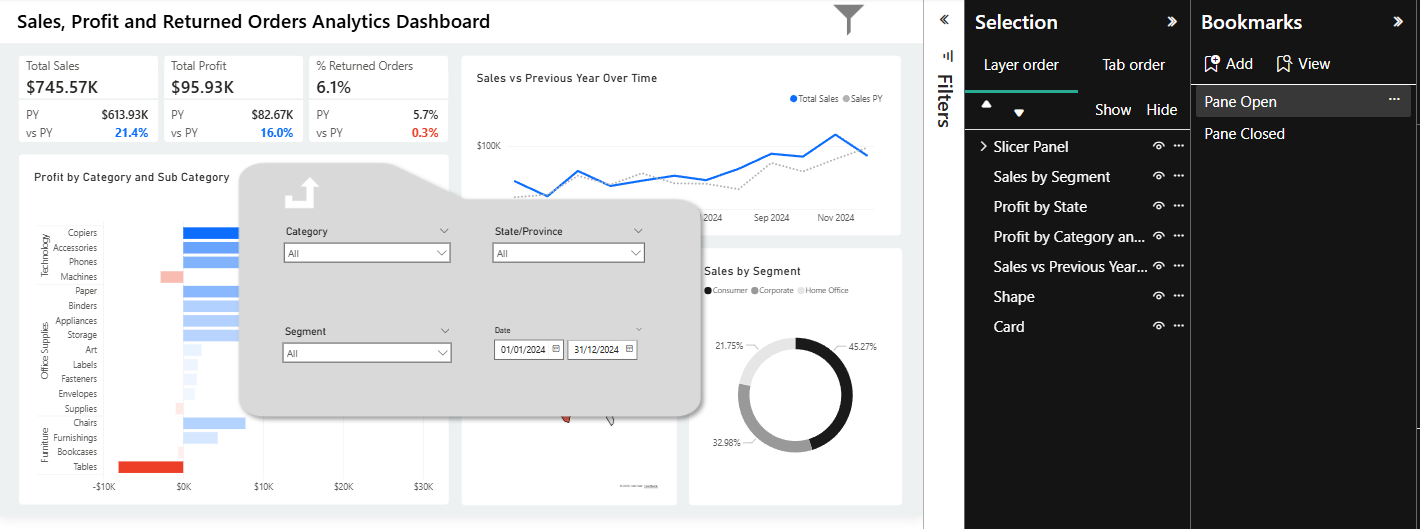
- Add Slicers: Drag your required slicers (e.g. Region, Segment, Year) on top of your shape/folder image. Ensure they are sized correctly and aligned neatly.
- Add a "Filter" Icon and a "Back" Icon: Insert a small "Back" arrow or icon or whichever icon you would like inside your shape/folder. Make sure the colour is white so when it sits on your grey shape/folder it can be seen. Do this for the slicer backgrounds too but remove the title background for a cleaner look. Then once your Slicer Pane/folder is set up don't forget to find a "Filter" icon too. These two icons will eventually be the buttons the user clicks to unhide/hide the menu.
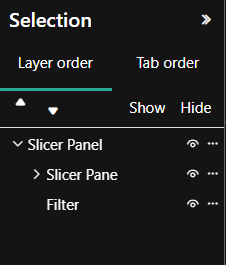
Step 2: Use the Selection Pane to Group Elements
To hide and show the menu as one unit, Power BI needs to know which objects belong together.
- Open the Pane: Go to the View tab and toggle on the Selection Pane.
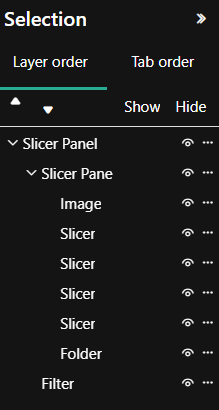
- Rename objects: In the selection pane, rename your two items to "Folder" and "Filter". Note I left the "Back" icon named as "Image" but you can also rename this as you wish.
- Group Objects: Hold Ctrl and in the selection pane, select the "Folder", all the Slicers, and the "Back" icon. Right-click and select Group. Rename this group to "Slicer Pane". Then do the same again and group the "Slicer Pane" and the "Filter" and rename this group to "Slicer Panel".
- Move to report page: Click the "Slicer Panel" in the selection menu and hold Ctrl and press 'c' to copy the entire panel. Then move to your main report page and paste the "Slicer Panel" by holding Ctrl and pressing 'v'.
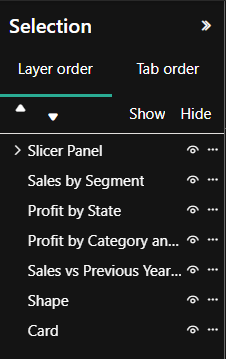
- Order Layers: Ensure the "Slicer Panel" group is at the very top of the Selection list so it appears in front of your charts when visible.
Step 3: Create the "Show" and "Hide" Bookmarks
Bookmarks capture the "state" of your report (what is visible and what isn't).
- Open Bookmarks: Go to the View tab and toggle on the Bookmarks Pane.
- The "Show" Bookmark:
- In the Selection Pane, make sure the "eye" icon is on, not crossed through, to make the "Slicer Panel" group visible.
- In the Bookmark Pane, click Add and rename it to "Pane Open".
- Crucial Setting: Right-click the bookmark and uncheck "Data." This ensures that if a user changes a filter, the menu doesn't reset their selection when they close it. Also right-click and check "Selected Visuals".
- The "Hide" Bookmark:
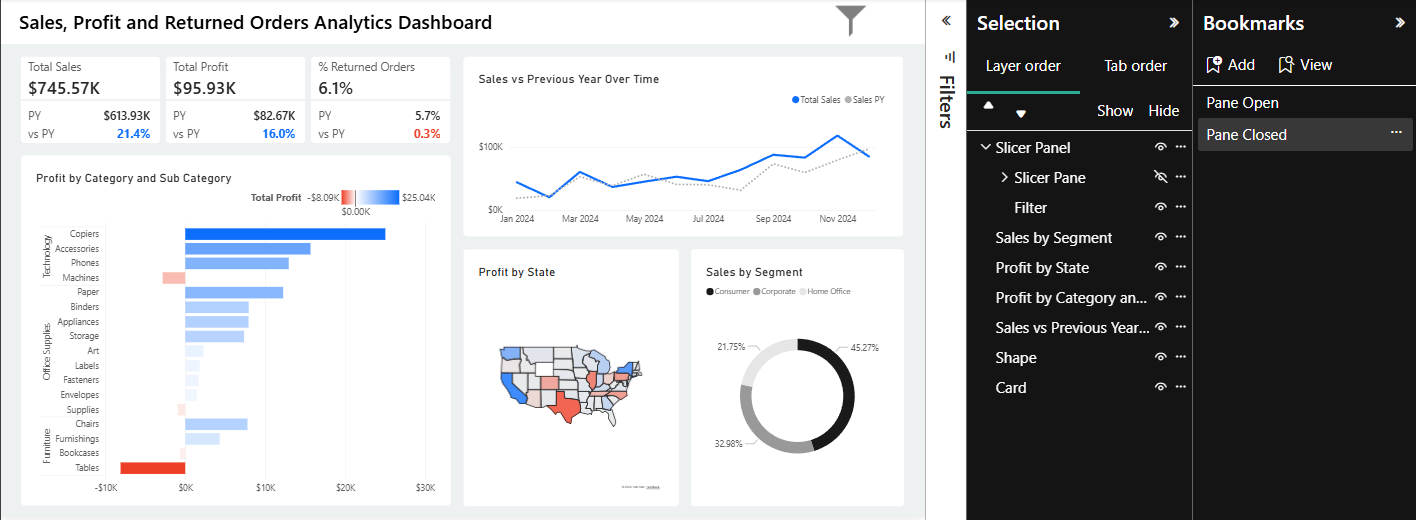
- In the Selection Pane, click the "eye" icon to hide the "Slicer Pane" group not the "Slicer Panel" as we still want our "Filter" icon visible.
- In the Bookmark Pane, click Add and rename it to "Panel Closed".
- Again, right-click and uncheck "Data" and check "selected Visuals".
Step 4: Assign Actions to Buttons
Now you need to link your icons to the bookmarks you just created.
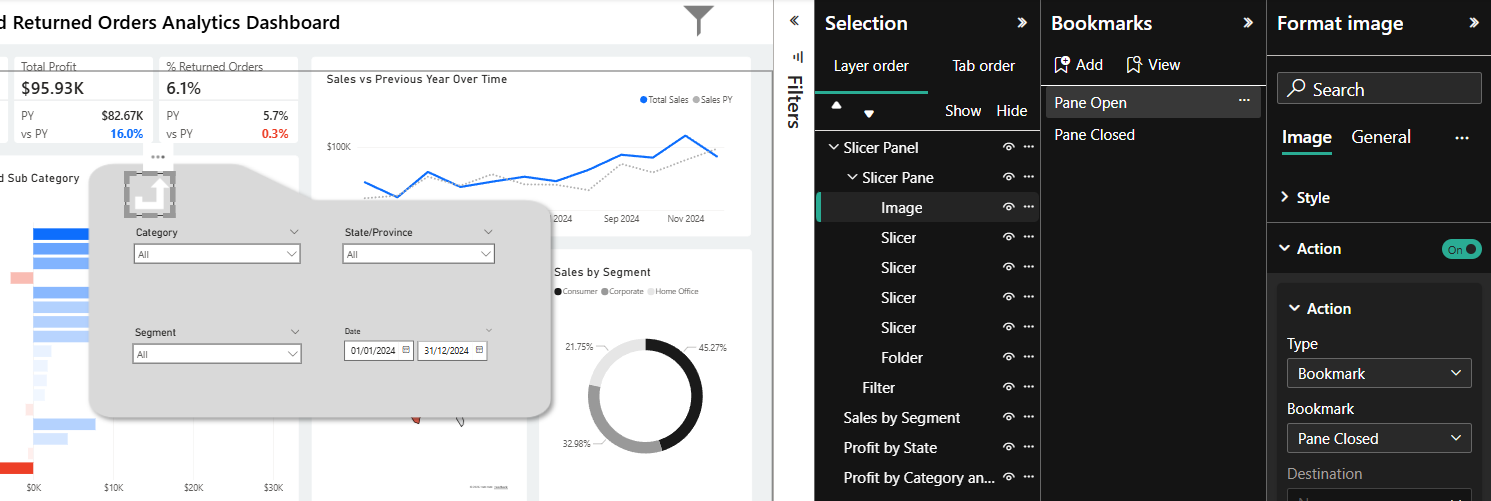
- The Filter Icon (Open):
- Select the main "Filter" icon on your dashboard.
- In the Format pane, turn on Action.
- Set the Type to Bookmark and select "Pane Open".
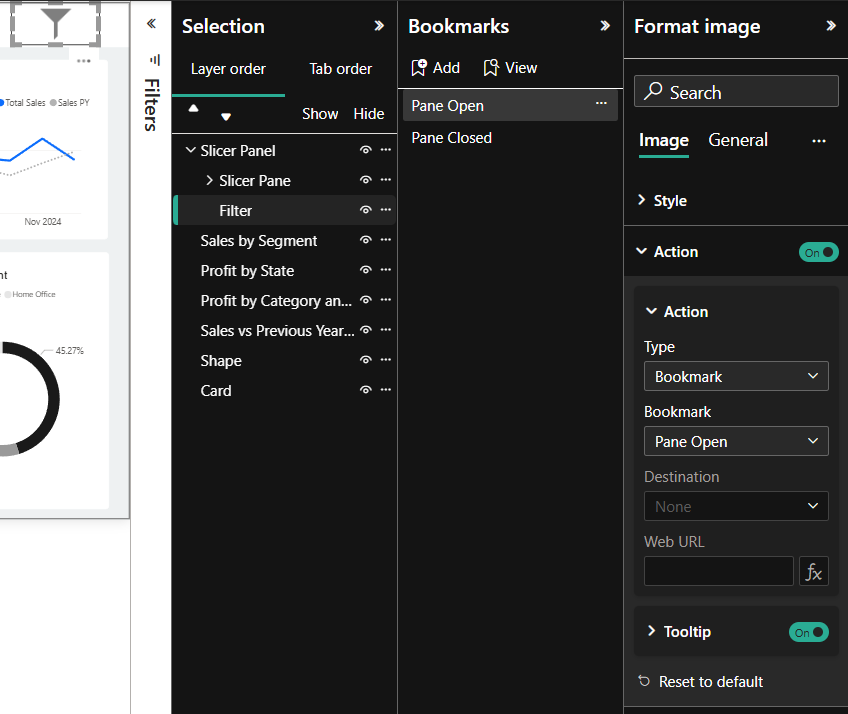
- The Back Icon (Close):
- Select the arrow or "Back" icon you chose inside your hidden panel.
- In the Format pane, turn on Action.
- Set the Type to Bookmark and select "Pane Closed".
The Result:
As you can now test in my above BI Report (or the ones you have created), when you click the "Back" arrow/icon, the folder disappears and clicking the "Filter" icon brings it back into view for you to change your filters to what ever you would like.
By following these steps, you transform a standard report into a high-end application experience that focuses on the data while keeping powerful filtering tools just one click away.