


After completing my Learn What The Data School Learns session, I came to the realization that I am very bad at explaining what granularity means. Typically because I keep getting Level of Detail mixed up with Granularity. So for the purpose of my own learning and for everyone who I confused in that training session, I will explain (properly) what granularity is!
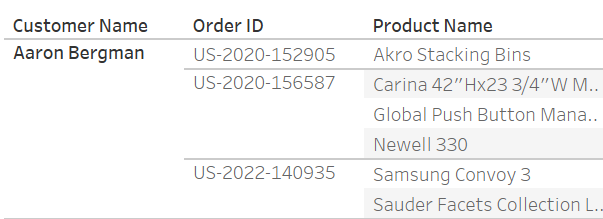
So to start off with, what is granularity? Essentially, it is how detailed your data set is. Typically, before you start drawing your wireframes or dashboarding, you want to analyze what one row in your data set represents. Let's use superstore data as an example - one row represents one product per order per customer as shown below:
This is the confusing part, a higher level of granularity refers to more detail within the data set (one product per order per customer is the highest level of granularity). This relates to having a lower level of detail. To put it simply...
Higher Granularity --> Lower Level of Detail e.g. product per order (lower of level of detail refers to the in depth detail of the data set)
Lower Granularity --> Higher Level of Detail e.g. city (higher level of detail refers to the surface level overview of the data set)
We can see this in the diagram below, how granularity increases but level of detail decreases.
